How to make your product prioritization more data-driven
Move beyond gut feel in product prioritization – how to build, organize, and centralize the KPIs and metrics that lead to better feature decisions.


Key Takeaways
Picking the right metric for the specific decision is the hardest part of data-driven prioritization, and it should happen before anyone pulls data.
Useful product KPIs trace from business outcome to the behavior that causes it, so every prioritization call can point to a measurable effect.
The AARRR funnel maps each feature to the stage it most directly moves, which makes trade-offs between acquisition and retention visible in a roadmap debate.
Data-driven product prioritization means using product KPIs and usage metrics to shape feature decisions.
Everyone's got opinions, but not everyone has evidence to back them up. In a roadmap review, it's often the loudest opinions that win out.
But on some level, everyone knows that data-driven product prioritization is the goal. Conversations grounded in evidence. Before gathering the evidence, however, it's critical to choose the right metric.
That's where teams often slip up. They adopt scorecards and dashboards, then discover the numbers aren't really answering the question. They track a KPI that turns out to be measured inconsistently.
Let's get into how to use data and why it's critical to choose the right metric before anything else.
Why use data to guide prioritization?
When prioritization is grounded in data:
You see trends instead of reacting to individual data points
The team builds a data-curious mindset that improves decisions across the board
You're more confident about what you choose to build – and what you don't
Alignment happens faster because everyone's working from the same information
Random requests without evidence are easier to deprioritize
Product discussions get less emotional
No universal formula exists. Every product and company has different constraints. But the three steps below – building reliable KPIs, organizing them clearly, centralizing access – create the foundation for more consistent, defensible decisions.
Step 1: Create reliable product KPIs and metrics
You probably already have KPIs. Are you actually using them when it's time to prioritize?
During any prioritization session, ask: "Is this decision going to bring us closer to our vision and goals?" If your current KPIs can't answer that, they need to be redefined. Vague metrics are worse than no metrics. They create the illusion of rigor without the substance.
Every relevant decision-maker should have access to these KPIs and see how they change across the product lifecycle. That requires more than numbers in a document. It requires KPIs specific enough to be actionable.
Three categories of product KPIs
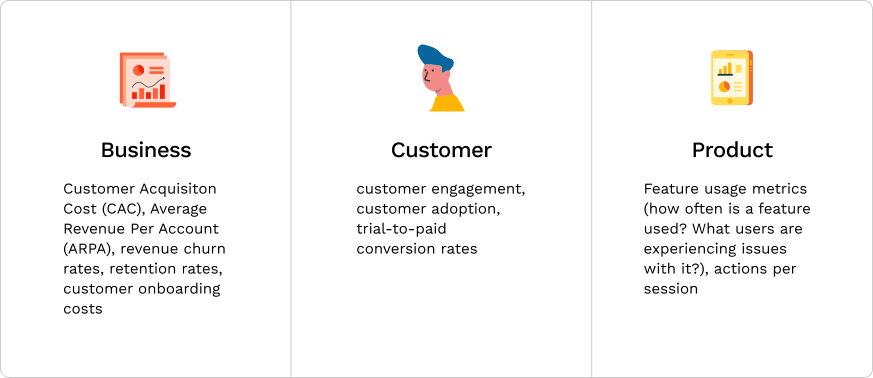
Product KPIs fall into three buckets. Each answers a different question, and all three need to be visible to the people making prioritization calls.
Category | What it measures | Example metrics |
|---|---|---|
Business metrics | Financial health of the product: cost and revenue | Revenue, CAC, LTV, gross margin |
Customer metrics | How well the product works for the people who use it | NPS, activation rate, usage frequency, churn |
Product metrics | Performance of individual features and functionality | Feature adoption, task success rate, time-to-value |
Step 2: Organize your product KPIs and metrics
Once you have the right KPIs, organize them so every stakeholder can read them at a glance. The most useful structure for product prioritization is the funnel.
Dave McClure's AARRR framework
AARRR (sometimes called "pirate metrics") maps your product's performance to five stages:
Acquisition: How do users find the product?
Activation: Do users have a good first experience?
Revenue: Are users paying, upgrading, or renewing?
Retention: Do users come back?
Referral: Do users bring other users?
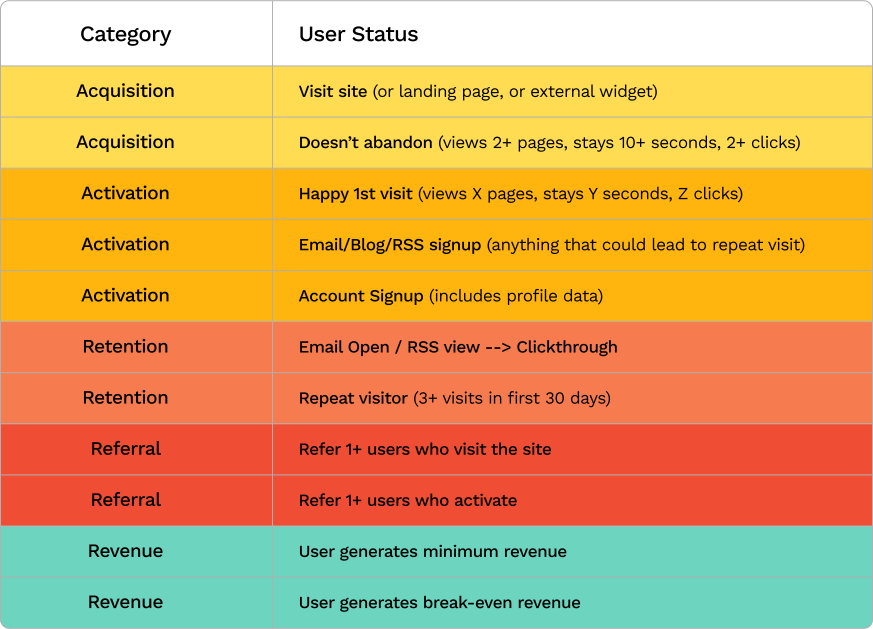
The point is to prioritize feature work based on improving conversion at each stage – for each metric type (business, customer, product). A feature that improves activation might be the right choice in Q2. A feature that fixes retention might be more urgent in Q3. The framework keeps that conversation grounded.
Other useful approaches: cohort analysis (how different user groups behave over time) and segmentation reports (how specific segments interact with specific parts of the product). The right analysis depends on the question you're trying to answer.
Step 3: Centralize your product KPIs and metrics
Data that lives in five different places isn't useful for team-wide prioritization. Neither is data only one person knows how to access. The goal is a centralized hub where everyone can get to the metrics they need, when they need them.
That hub should contain both quantitative analytics and qualitative customer feedback – support tickets, survey results, interview notes. Put them together and the team can hold a prioritization meeting informed by the full picture, not just whatever data is most convenient.
Make your KPIs and metrics accessible to everyone who participates in prioritization. A KPI dashboard that only the data team can read defeats the purpose.
Choosing an analytics platform
The right tool depends on your product type and the scale of metrics you track. When evaluating:
Integrations – pre-built connections with your existing stack? Accessible APIs for custom work?
Features – compliance requirements, control over data collection and storage, raw data access.
Implementation – what does it cost to set up correctly, and what internal resources does that take?
Amplitude, Mixpanel, PostHog – all commonly used by product teams for behavioral analytics. The specific tool matters less than how consistently the team uses it.
Being data-informed, not data-driven
There's an important distinction between data-driven and data-informed, as Uzma Barlaskar explains in why you should be data-informed and not data-driven.
Data-driven means reacting to what the numbers say. Data-informed means using data as one input among several – customer conversations, product intuition, strategic context – to make better decisions. Data-informed teams take time to understand the factors behind the numbers. Not just the numbers alone.
That distinction matters. Analysis paralysis is real. Teams that go too deep into metrics can lose the ability to make fast, confident calls. The goal is to support decision-making, not replace it.
A PM's instinct is valuable. But it should be trained and tested against data, not substituted for it. Use metrics to challenge assumptions, validate hypotheses, and ground prioritization in data-based decisions. Then make the call.
Further reading: Prioritization process.
Sign up for a demo
Request Demo
2026 State of SPM report
This is the data you've been looking for
This original research from almost 700 PMO leaders shows you what is working, what is wobbling, and what it all means for SPM in 2026.
Download the 2026 State of SPM reportFrequently Asked Questions
Couldn't find what you need?Go to our documentation
Data-driven prioritization means using objective metrics – user behavior, business performance, customer feedback – as the primary basis for deciding which features to build next. It does not mean ignoring judgment or context; it means making sure judgment is informed by evidence rather than opinion or political pressure.
It depends on your product’s current growth stage. Early-stage products typically focus on acquisition and activation metrics – can people find the product and have a good first experience? Growth-stage products tend to focus on retention and referral. The AARRR framework gives you a structure to assess which stage your biggest opportunities sit in.
Set a time limit on the data-gathering phase of your prioritization process before you enter the decision meeting. Define in advance which two or three metrics are the primary inputs for the decision at hand. Rely on those, consult the data, then make the call. Revisit and adjust at the next planning cycle. Perfect data does not exist – the goal is better decisions faster, not perfect decisions eventually.
Make the metrics visible and accessible to everyone who participates in prioritization decisions. When stakeholders can see the same data and understand how it connects to business goals, the conversation shifts from “I think we should build X” to “the data suggests X solves a bigger problem than Y.” That shift makes alignment faster and decisions more durable.