What is a mermaid diagram and why should you use one?
What is a mermaid diagram and why should you use one?
Mermaid diagrams help teams visualize complex processes and systems using simple text-based code. These diagrams turn plain text into flowcharts, sequence diagrams, and other visual representations that make information easier to understand and share.
Whether you're documenting software architecture, mapping workflows, or planning projects, mermaid diagramming offers a straightforward way to create professional visuals without specialized design software.
Understanding mermaid diagrams
A mermaid diagram is a visual representation created from text-based instructions using the Mermaid JavaScript library. Instead of dragging and dropping shapes in a visual editor, you write simple code that automatically generates diagrams.
The syntax is designed to be readable and intuitive. For example, you can create a basic flowchart by writing "A --> B" to show that step A leads to step B. The Mermaid tool then renders this text into a polished diagram.
Mermaid diagrams support multiple diagram types including flowcharts, sequence diagrams, class diagrams, state diagrams, entity relationship diagrams, user journey maps, Gantt charts, and pie charts. This versatility makes them valuable across different teams and use cases.
Why use mermaid diagrams?
Traditional diagramming tools often require proprietary file formats and specialized software. Mermaid diagrams solve this problem by using plain text that lives alongside your other documentation.
Here are the main advantages:
Version control friendly: Because mermaid diagrams are text, you can track changes using Git or other version control systems. You can see exactly what changed between diagram versions, review updates, and revert changes if needed.
Collaboration made easier: Team members can edit diagrams using any text editor. There's no need to purchase licenses for expensive diagramming software or worry about file compatibility issues.
Documentation integration: You can embed mermaid diagrams directly into Markdown files, wikis, and documentation platforms. Your diagrams live with your content rather than as separate attachments.
Faster updates: Modifying a diagram is as simple as editing text. You don't need to realign shapes or redraw connections when making changes.
Accessibility: Plain text diagrams work better with screen readers and other assistive technologies compared to image-based diagrams.
How to create mermaid diagrams
Creating mermaid diagrams starts with learning the basic syntax. Each diagram type has its own keywords and structure, but the principles remain consistent.
Here's a simple flowchart example. You define nodes and connect them with arrows:
graph TD
A[Start] --> B[Process Data]
B --> C{Decision}
C -->|Yes| D[Action 1]
C -->|No| E[Action 2]
For a mermaid sequence diagram, you show interactions between participants:
sequenceDiagram
Alice->>Bob: Hello Bob
Bob->>Alice: Hi Alice
The Mermaid library automatically handles the visual layout, spacing, and styling based on your text instructions.
Where to use mermaid diagrams
Many platforms and tools support mermaid diagramming natively or through extensions. GitHub automatically renders mermaid diagrams in Markdown files and README documents. This makes it easy to include visual documentation in your repositories.
Popular code editors like Visual Studio Code offer extensions to render mermaid diagrams. These extensions let you preview diagrams as you write them, providing immediate visual feedback.
Documentation platforms often include mermaid support. Many static site generators and wiki systems can render mermaid diagrams directly in your content.
Adding mermaid diagrams in Confluence
Confluence doesn't support mermaid diagrams natively in its cloud or data center versions. However, you have several workarounds to include these visuals in your Confluence pages.
One approach is to convert your mermaid diagram to an image and upload it to Confluence. This method works well for diagrams that don't change frequently.
Another option is to use third-party apps from the Atlassian Marketplace. Several apps add mermaid rendering capabilities to Confluence, though these typically require installation by a Confluence administrator.
For teams that want to keep mermaid code in Confluence without rendering, you can use code blocks to preserve the syntax. This lets team members copy the code and render it elsewhere.
How to render mermaid diagrams
Rendering a mermaid diagram means converting the text code into a visual diagram. The process varies depending on your platform.
Rendering in Markdown
To render a mermaid diagram in Markdown files, wrap your mermaid code in a fenced code block with the language identifier "mermaid":
```mermaid
graph LR
A --> B
```
Platforms that support mermaid will automatically render this code as a diagram. GitHub, GitLab, and many documentation platforms handle this natively.
Rendering in VS Code
Visual Studio Code requires an extension to render mermaid diagrams. After installing a mermaid preview extension, you can view diagrams alongside your code.
Most extensions add a preview pane that updates in real time as you edit your diagram code. This immediate feedback helps you catch syntax errors and refine your diagrams.
Exporting and saving mermaid diagrams
Once you've created a mermaid diagram, you might need to save it as an image file for presentations, reports, or other platforms.
Converting mermaid diagrams to images
Several online tools let you convert mermaid diagrams to images for free. The official Mermaid Live Editor (mermaid.live) provides an easy way to paste your code and download the result as PNG or SVG.
Many tools let you customize the appearance before exporting. You can adjust colors, fonts, and other styling elements to match your brand or presentation needs.
Exporting from different platforms
The export process depends on where you're creating your diagram. In VS Code with a mermaid extension, you typically right-click the preview and select an export option.
On GitHub, you can take a screenshot of the rendered diagram, though this produces a raster image. For better quality, copy your code to an online converter that exports vector formats like SVG.
Command-line tools also exist for automated diagram generation. The Mermaid CLI lets you batch-process multiple diagrams or integrate diagram generation into build pipelines.
Common mermaid diagram types
Understanding the different diagram types helps you choose the right visualization for your needs.
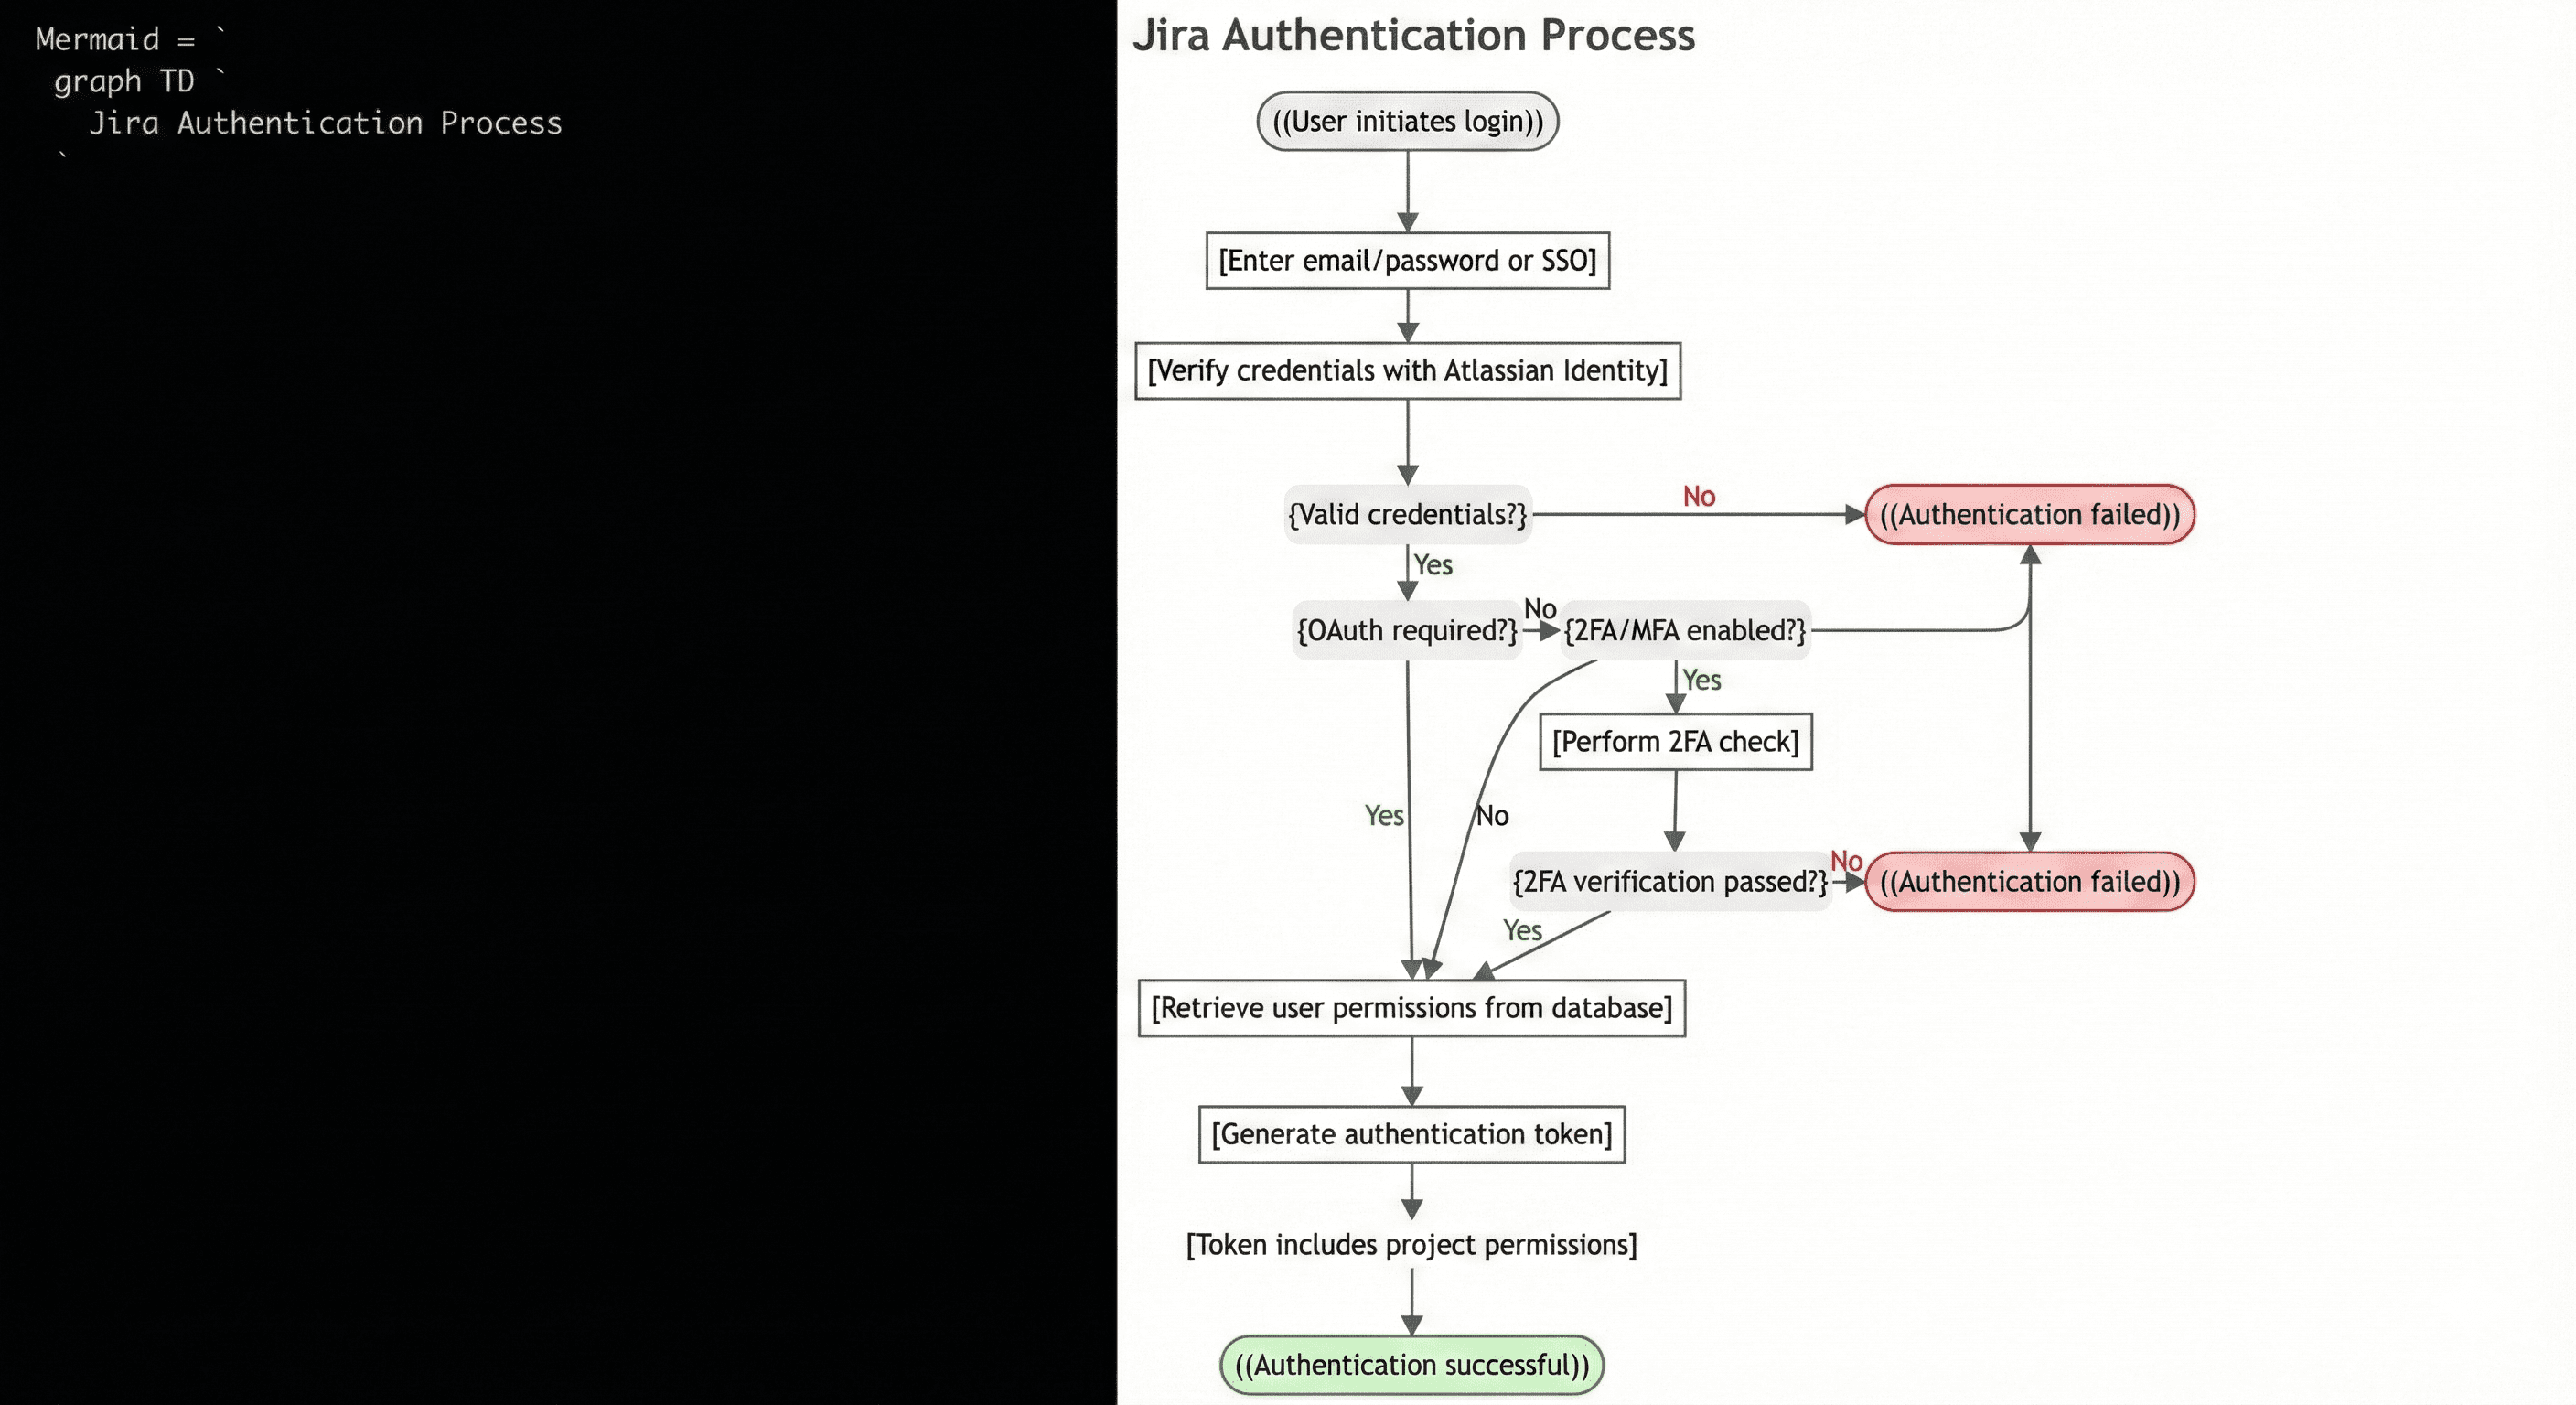
Flowcharts show processes with decision points and branches. They work well for documenting algorithms, business processes, and user flows.
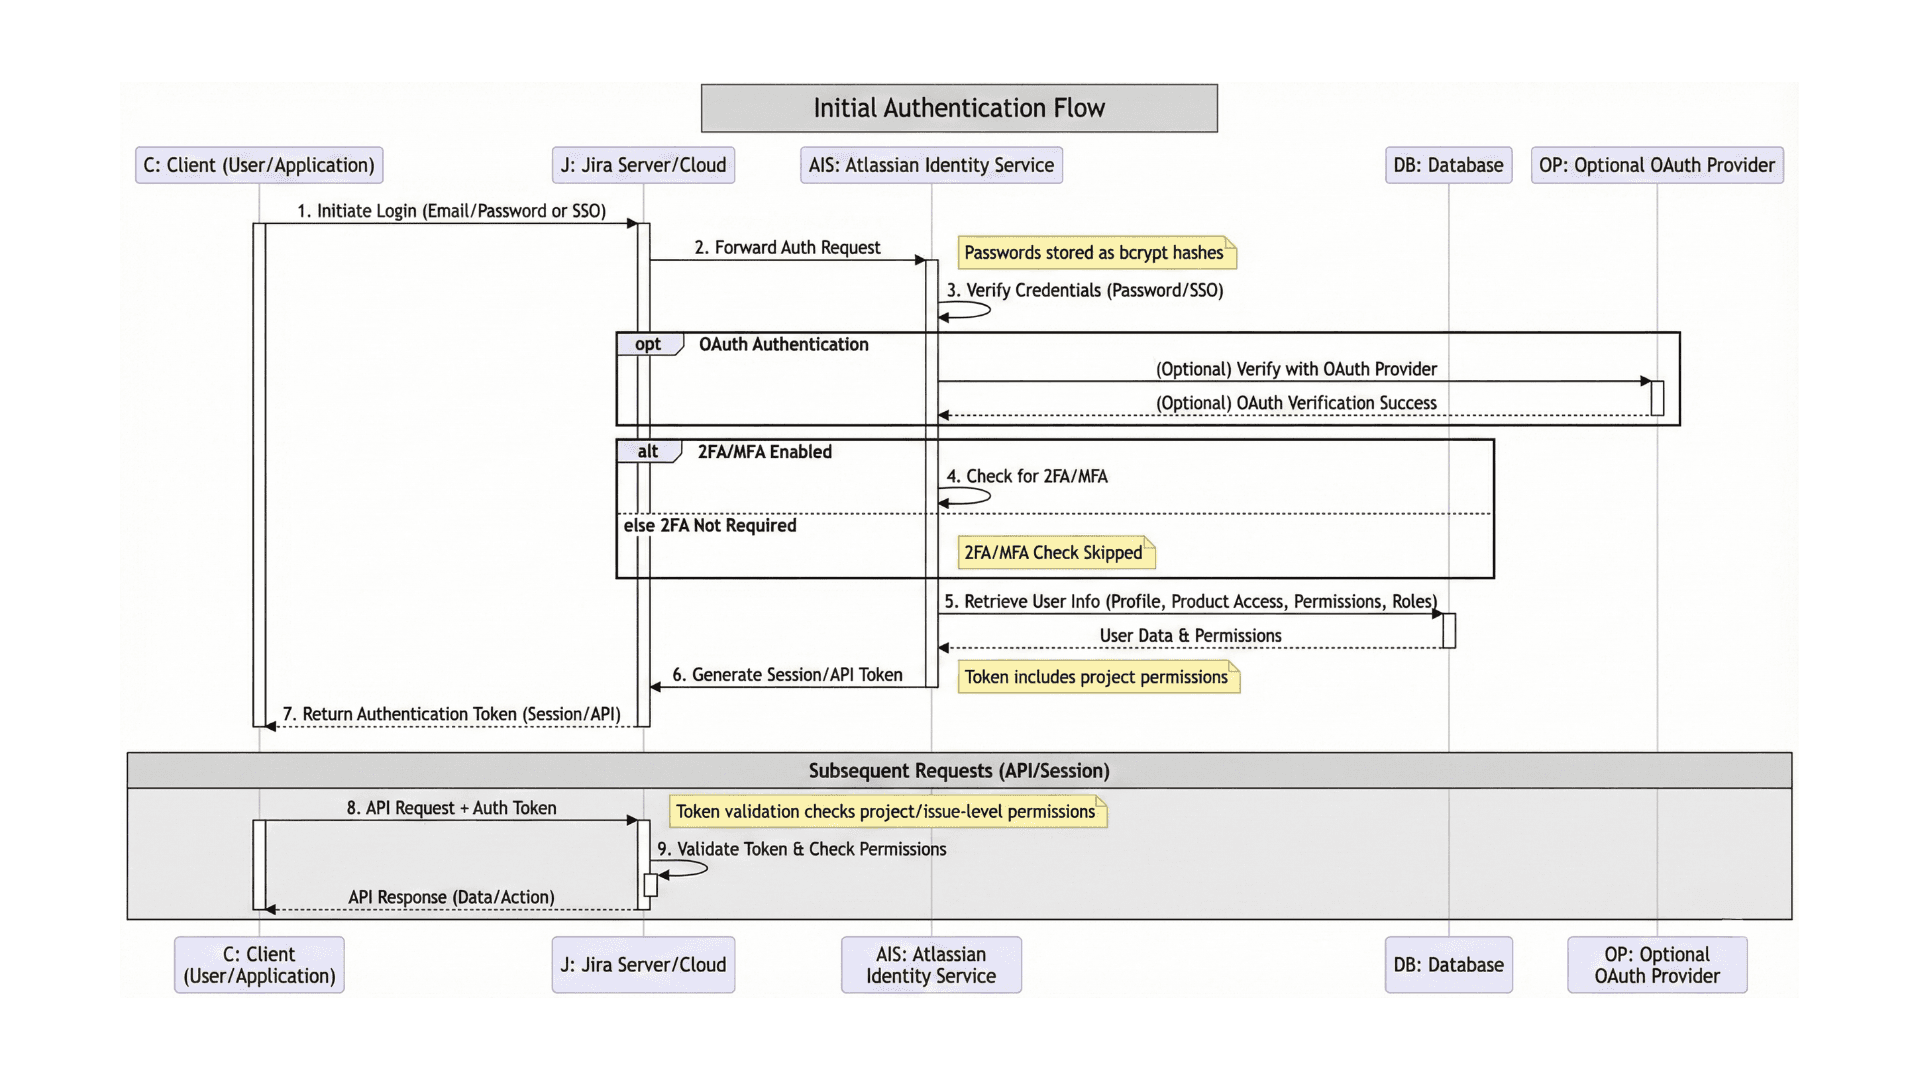
Sequence diagrams illustrate interactions between different actors or systems over time. Software teams use these to document API calls, user authentication flows, and system integrations.
Class diagrams represent object-oriented programming structures. They show classes, their attributes, methods, and relationships.
State diagrams map out different states an object or system can be in and the transitions between those states. These help teams understand complex state management in applications.
Entity relationship diagrams visualize database structures and the relationships between different data entities.
Tips for effective mermaid diagrams
Keep your diagrams focused on a single concept or process. Complex diagrams with too many elements become hard to read and maintain.
Use descriptive labels for nodes and connections. Clear labels make diagrams self-explanatory and reduce the need for additional documentation.
Follow consistent naming conventions across related diagrams. This consistency helps team members understand your visual language.
Add comments to your mermaid code to explain complex sections or provide context. Comments don't appear in the rendered diagram but help future editors understand your intent.
Test your diagrams on different platforms if they'll be viewed in multiple places. Rendering can vary slightly between implementations.
Limitations to consider
While mermaid diagrams offer many benefits, they have some limitations. Complex diagrams with many elements can become difficult to code and maintain in text format.
Styling options, while improving, remain more limited than dedicated diagramming tools. Fine-grained control over positioning and appearance may not be possible.
Not all platforms support all diagram types. Check compatibility before committing to mermaid for critical documentation.
Getting started with mermaid diagrams
The best way to learn mermaid diagramming is through practice. Start with simple flowcharts and gradually explore more complex diagram types.
The official Mermaid documentation provides comprehensive syntax references and examples for each diagram type. The Mermaid Live Editor offers an interactive environment where you can experiment without installing anything.
Many teams start by converting one or two existing diagrams to mermaid syntax. This hands-on approach helps you understand the syntax while producing useful documentation.
Visualize project workflows with Strategic Roadmaps
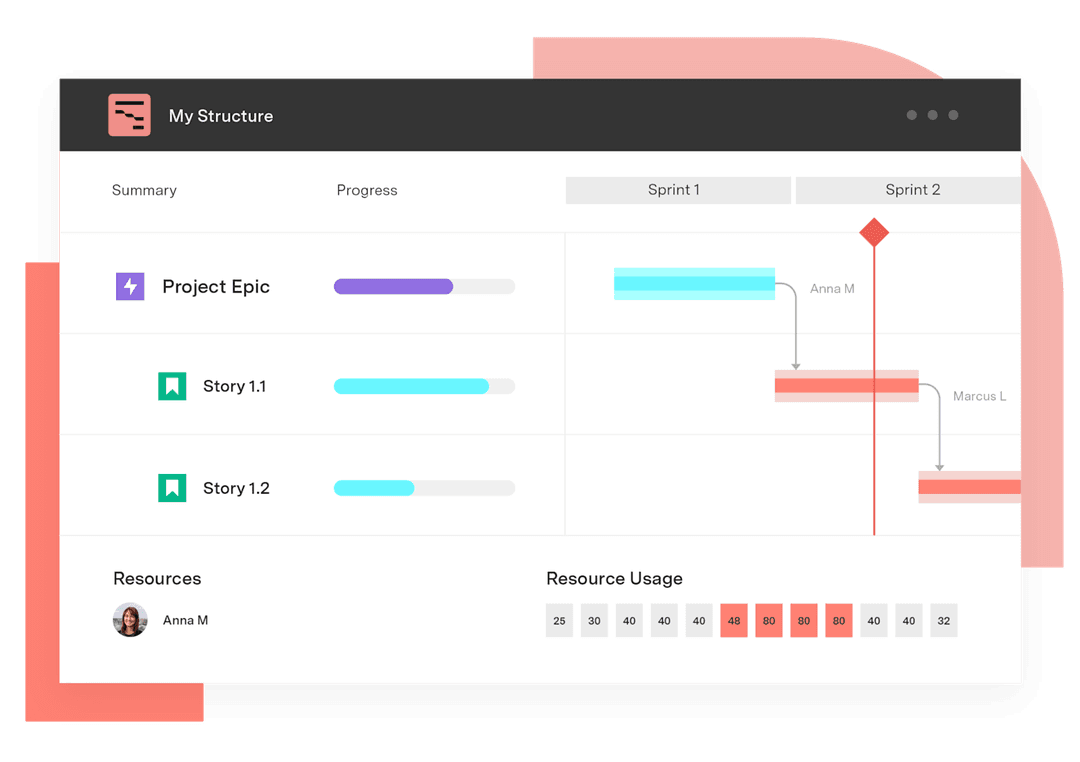
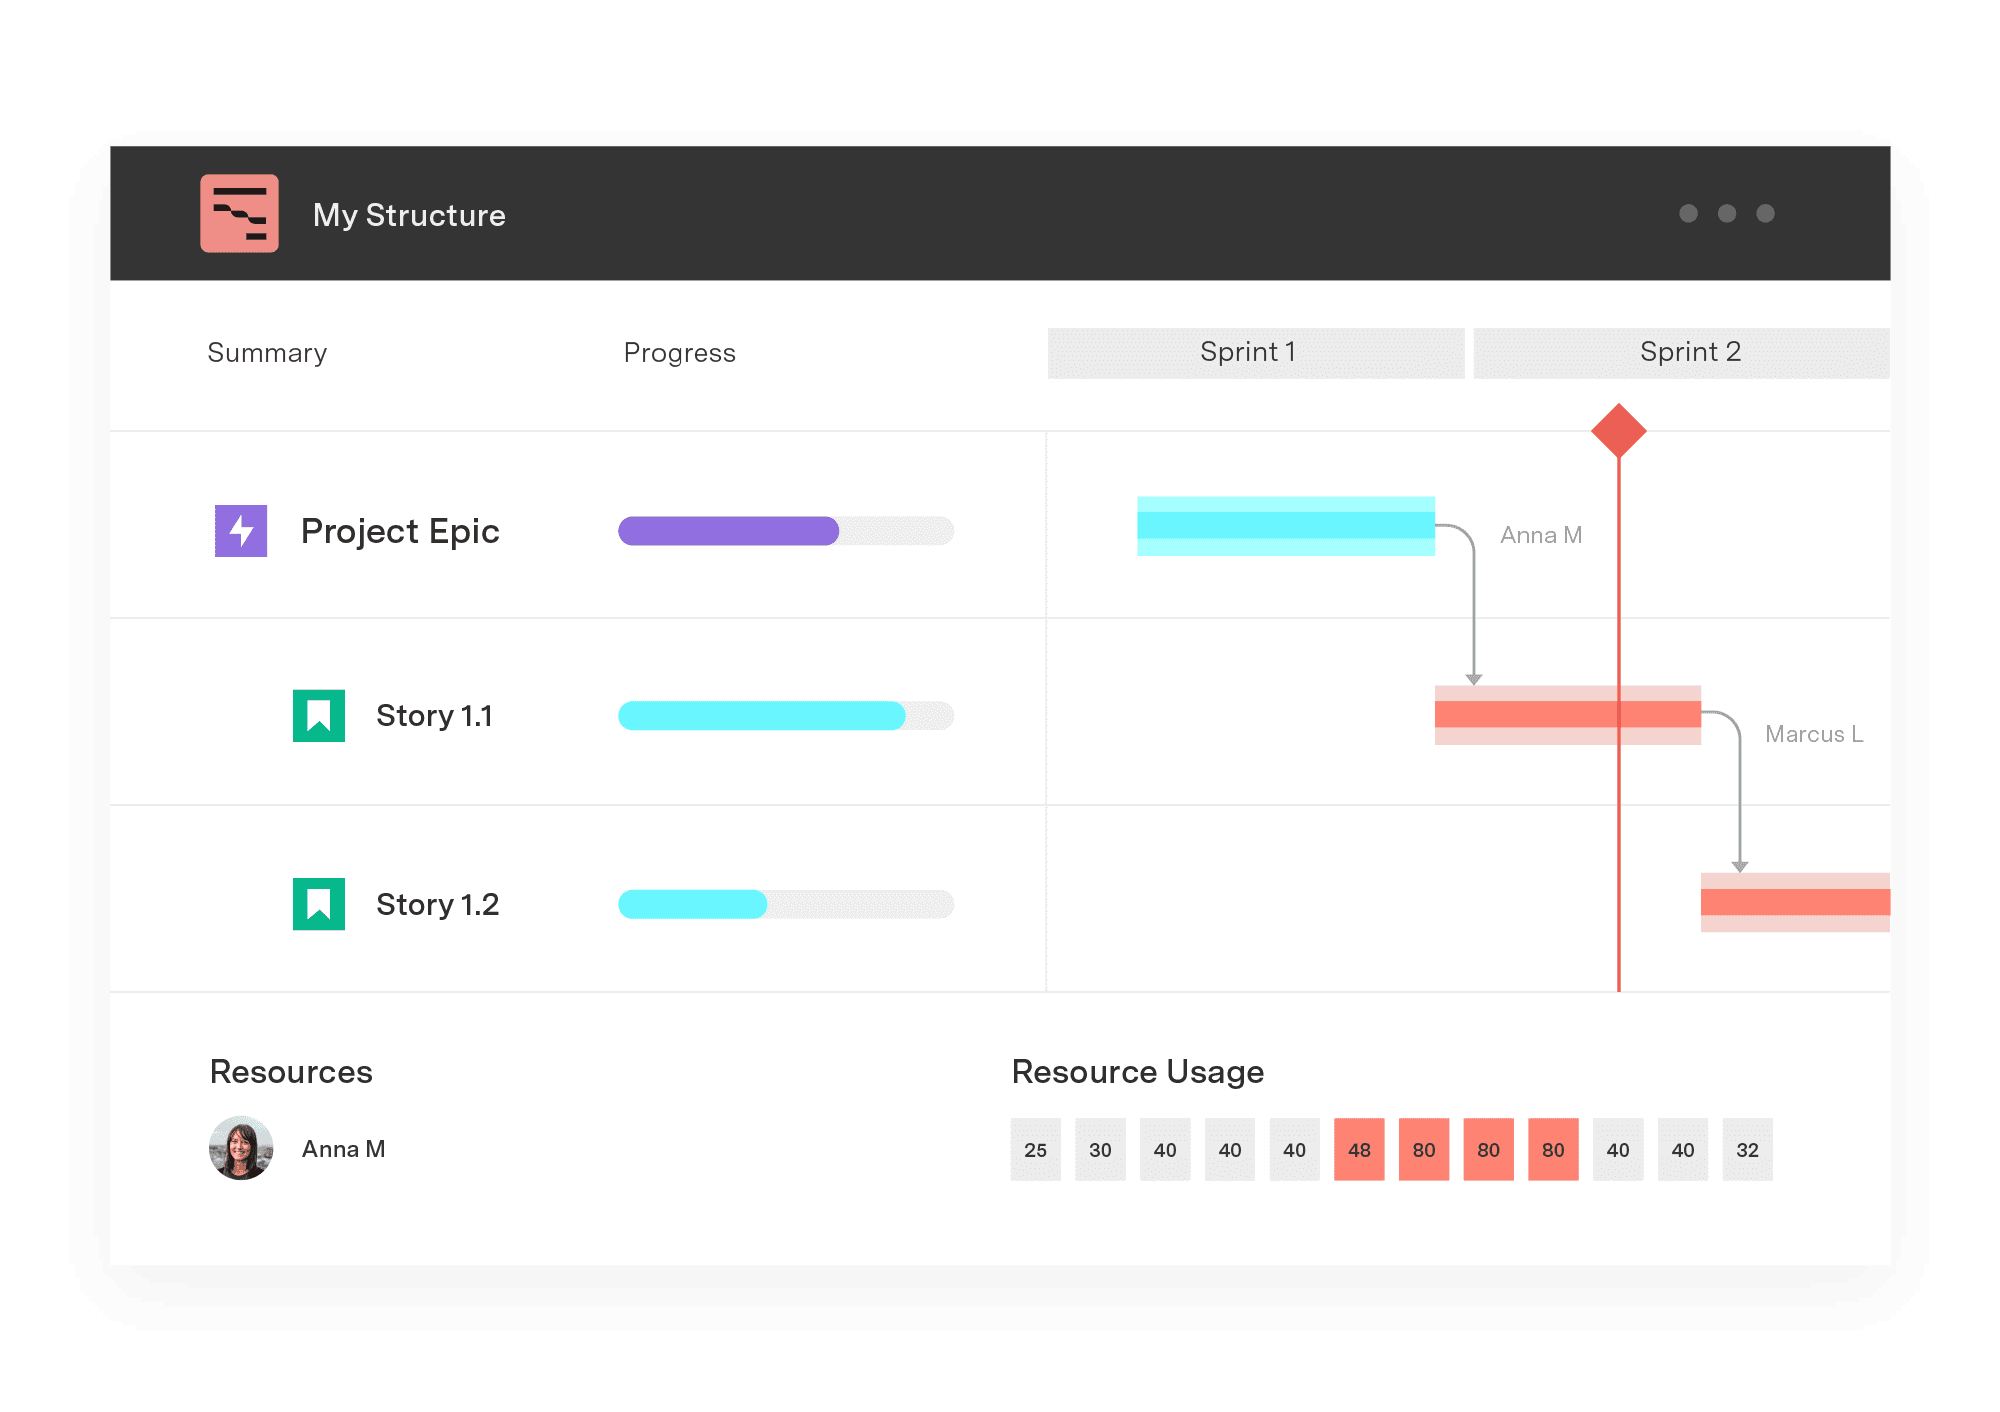
Mermaid diagrams map out processes and system architecture, while Tempo's Strategic Roadmaps takes visualization to the project delivery level. Strategic Roadmaps lets you create visual timelines, making it easier for stakeholders to understand priorities and dependencies.
The tool integrates directly with Jira, so your roadmaps stay connected to real-time project data. You can map out initiatives, track progress, and communicate your strategy without switching between multiple tools. Start a free trial of Tempo Strategic Roadmaps to see how visual planning can transform your project communication.
Sign up for a demo
Request DemoGetting started with mermaid diagrams
The best way to learn mermaid diagramming is through practice. Start with simple flowcharts and gradually explore more complex diagram types.
The official Mermaid documentation provides comprehensive syntax references and examples for each diagram type. The Mermaid Live Editor offers an interactive environment where you can experiment without installing anything.
Many teams start by converting one or two existing diagrams to mermaid syntax. This hands-on approach helps you understand the syntax while producing useful documentation.
Mermaid diagrams bridge the gap between code and visual communication. They let technical teams create and maintain diagrams using the same tools and workflows they already know.
The text-based approach makes diagrams versionable, reviewable, and easier to keep in sync with your code. While they may not replace diagramming tools for all use cases, they excel at documentation that evolves with your project.
Whether you're documenting software architecture, planning workflows, or explaining complex systems, mermaid diagrams offer a practical solution that integrates seamlessly with modern development practices.