Measure how long Jira issues take to close, broken down by status. The resolution time report turns workflow drift into a number you can act on.

Explore the potential of Jira gadgets with our guide and gain critical insights into team progress and data, enhancing analytical capabilities. Jira dashboard gadgets are windows to project summaries, reports, and important information collected for your analytical business needs. From exploiting Jira Cloud software to integrating advanced add-ons like Power BI Connector for Jira, our guide is your roadmap for maximizing dashboard investment.


Jira reporting functionality is divided into two distinct approaches: project reporting and dashboard reporting. Project reporting involves accessing individual projects, navigating to a board, and selecting the desired report from the available options. Conversely, Jira dashboard reporting offers a broader perspective by adding multiple reports across various projects onto a single screen, providing users with a comprehensive overview of ongoing activities. This dual approach allows users to build their reporting strategy based on the scope and complexity of their projects.
In Jira dashboards, gadgets represent specific reports or visualizations that users can add to their dashboard interface. These gadgets, ranging from charts to graphs and diagrams, are directly derived from Jira data and configured within the dashboard. Each Jira dashboard gadget functions as a separate window or block on the dashboard screen, offering users a customizable display of project insights and metrics. This modular approach empowers users to design dashboards according to their unique reporting needs and analytical preferences.
If you compare gadgets with static snapshots, gadgets in Jira dashboard are dynamic, providing real-time updates and insights. These updates occur automatically upon loading the dashboard or at predefined intervals, ensuring users can access the latest information without manual intervention. Jira dashboards serve as the primary interface for users upon opening the platform, showcasing various apps and gadgets designed to facilitate project organization and tracking. By leveraging the dynamic capabilities of gadgets in Jira, users can stay informed, make appropriate decisions, and confidently manage their projects.
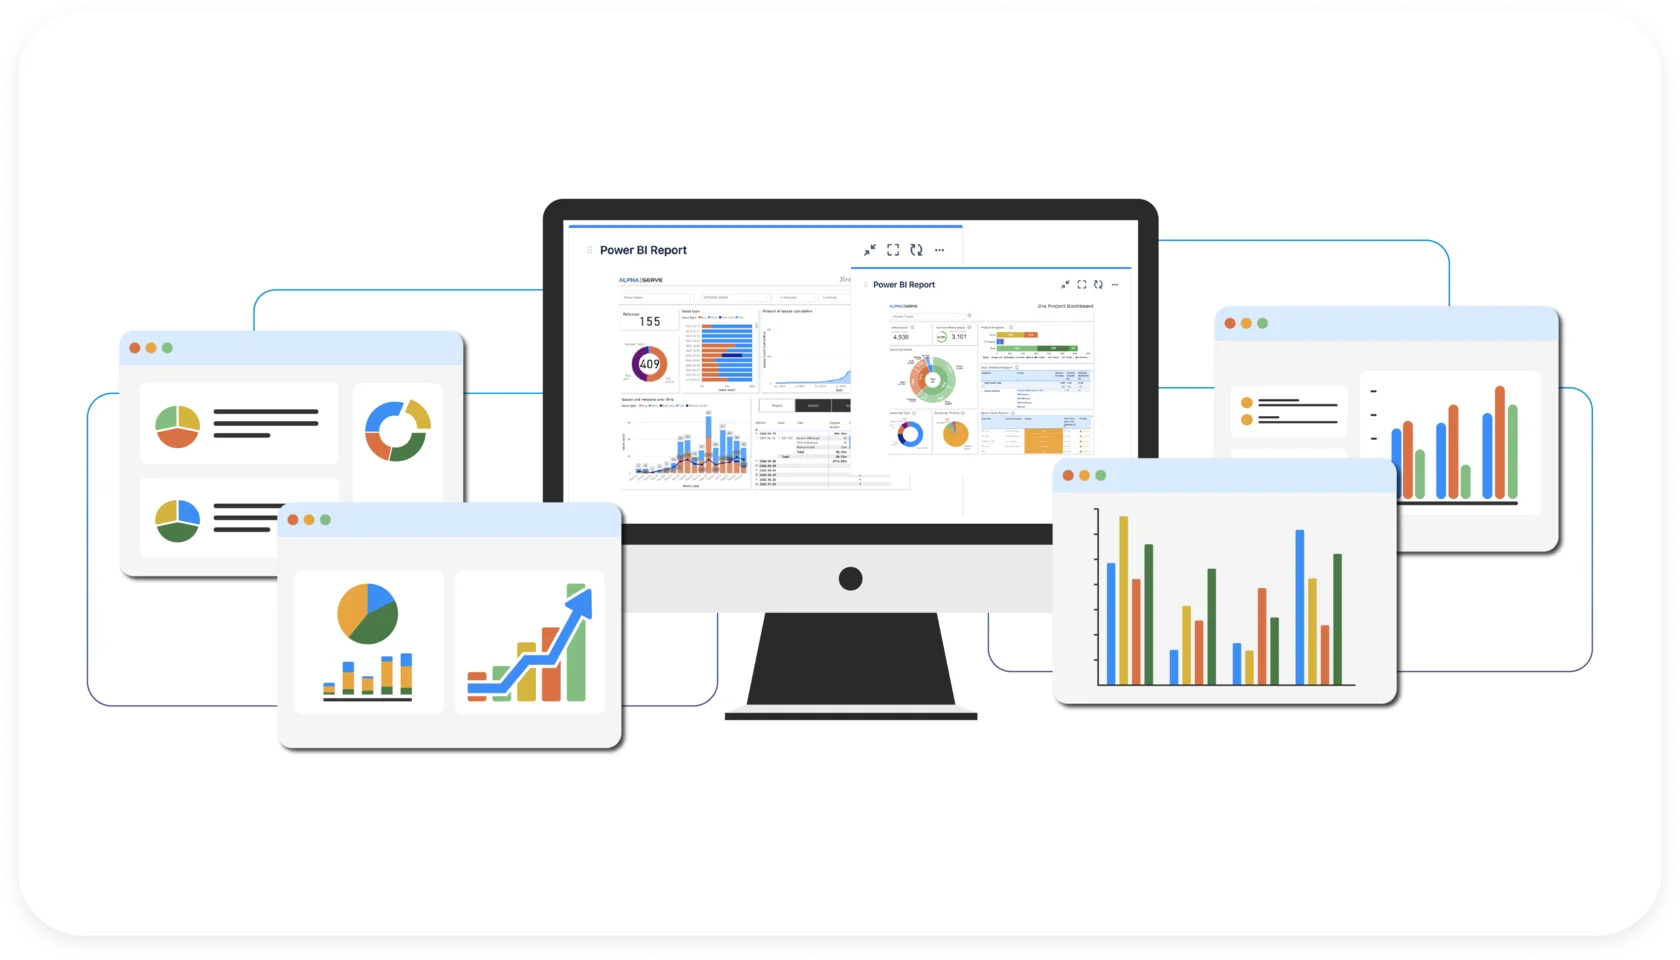
The best Jira dashboard gadgets offer an overload of functionalities to enhance your Agile dashboards. Jira dashboard gadgets, compact applications displaying project data summaries or custom filters, empower users to build their dashboards to specific needs. When selecting gadgets for Jira dashboard, it's crucial to consider the information relevant to you and your team. Start with a proper number of gadgets, typically three to six, to avoid mess. Overloading your Jira dashboard with too many gadgets can confuse and block the communication of your intended message. With a vast array of gadgets available, experimentation is key to finding the most suitable ones for your reporting requirements.
Explore the best Jira gadgets supported with our Jira dashboard examples to identify the most suitable options for your reporting needs.
The Assigned To Me Gadget in Jira is a valuable tool designed for personal dashboards. It provides a convenient overview of all open issues across various projects assigned to the user viewing the dashboard. This gadget specifically lists to-do and in-progress tasks, making it easier for users to manage their workload efficiently by highlighting the issues that require their attention.
The Activity Stream Gadget in Jira offers a comprehensive overview of recent activity within your project. It is a centralized hub where you can monitor updates, comments, and changes made by team members, providing valuable insights into project progression and collaboration. This gadget in Jira dashboard enhances transparency and facilitates communication among team members by displaying a summary of recent activities.
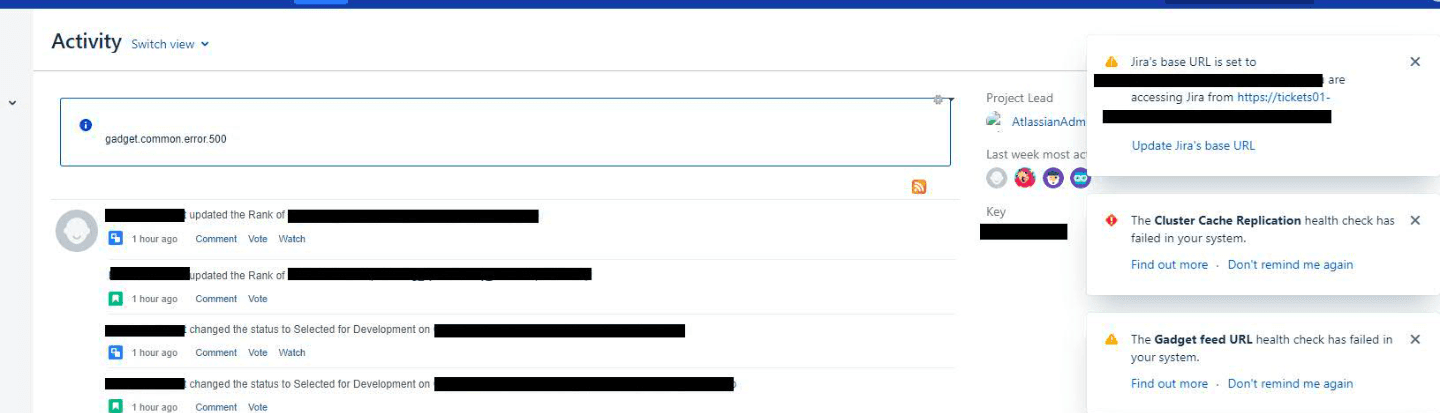
The Activity Stream Gadget functions similarly to the recently updated macro. It showcases a list of the most recently changed content within your Jira site. This gadget not only presents a chronicle of recent updates but also organizes them by date. Moreover, it offers additional functionalities, such as the capability to add comments to pages and blog posts directly from the gadget, along with the ability to reply to comments. Additionally, users can access an RSS feed link for convenient access to the gadget's content.
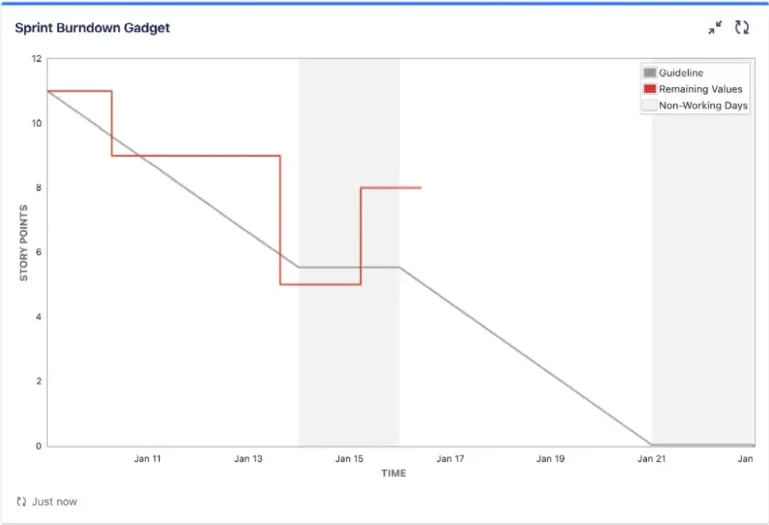
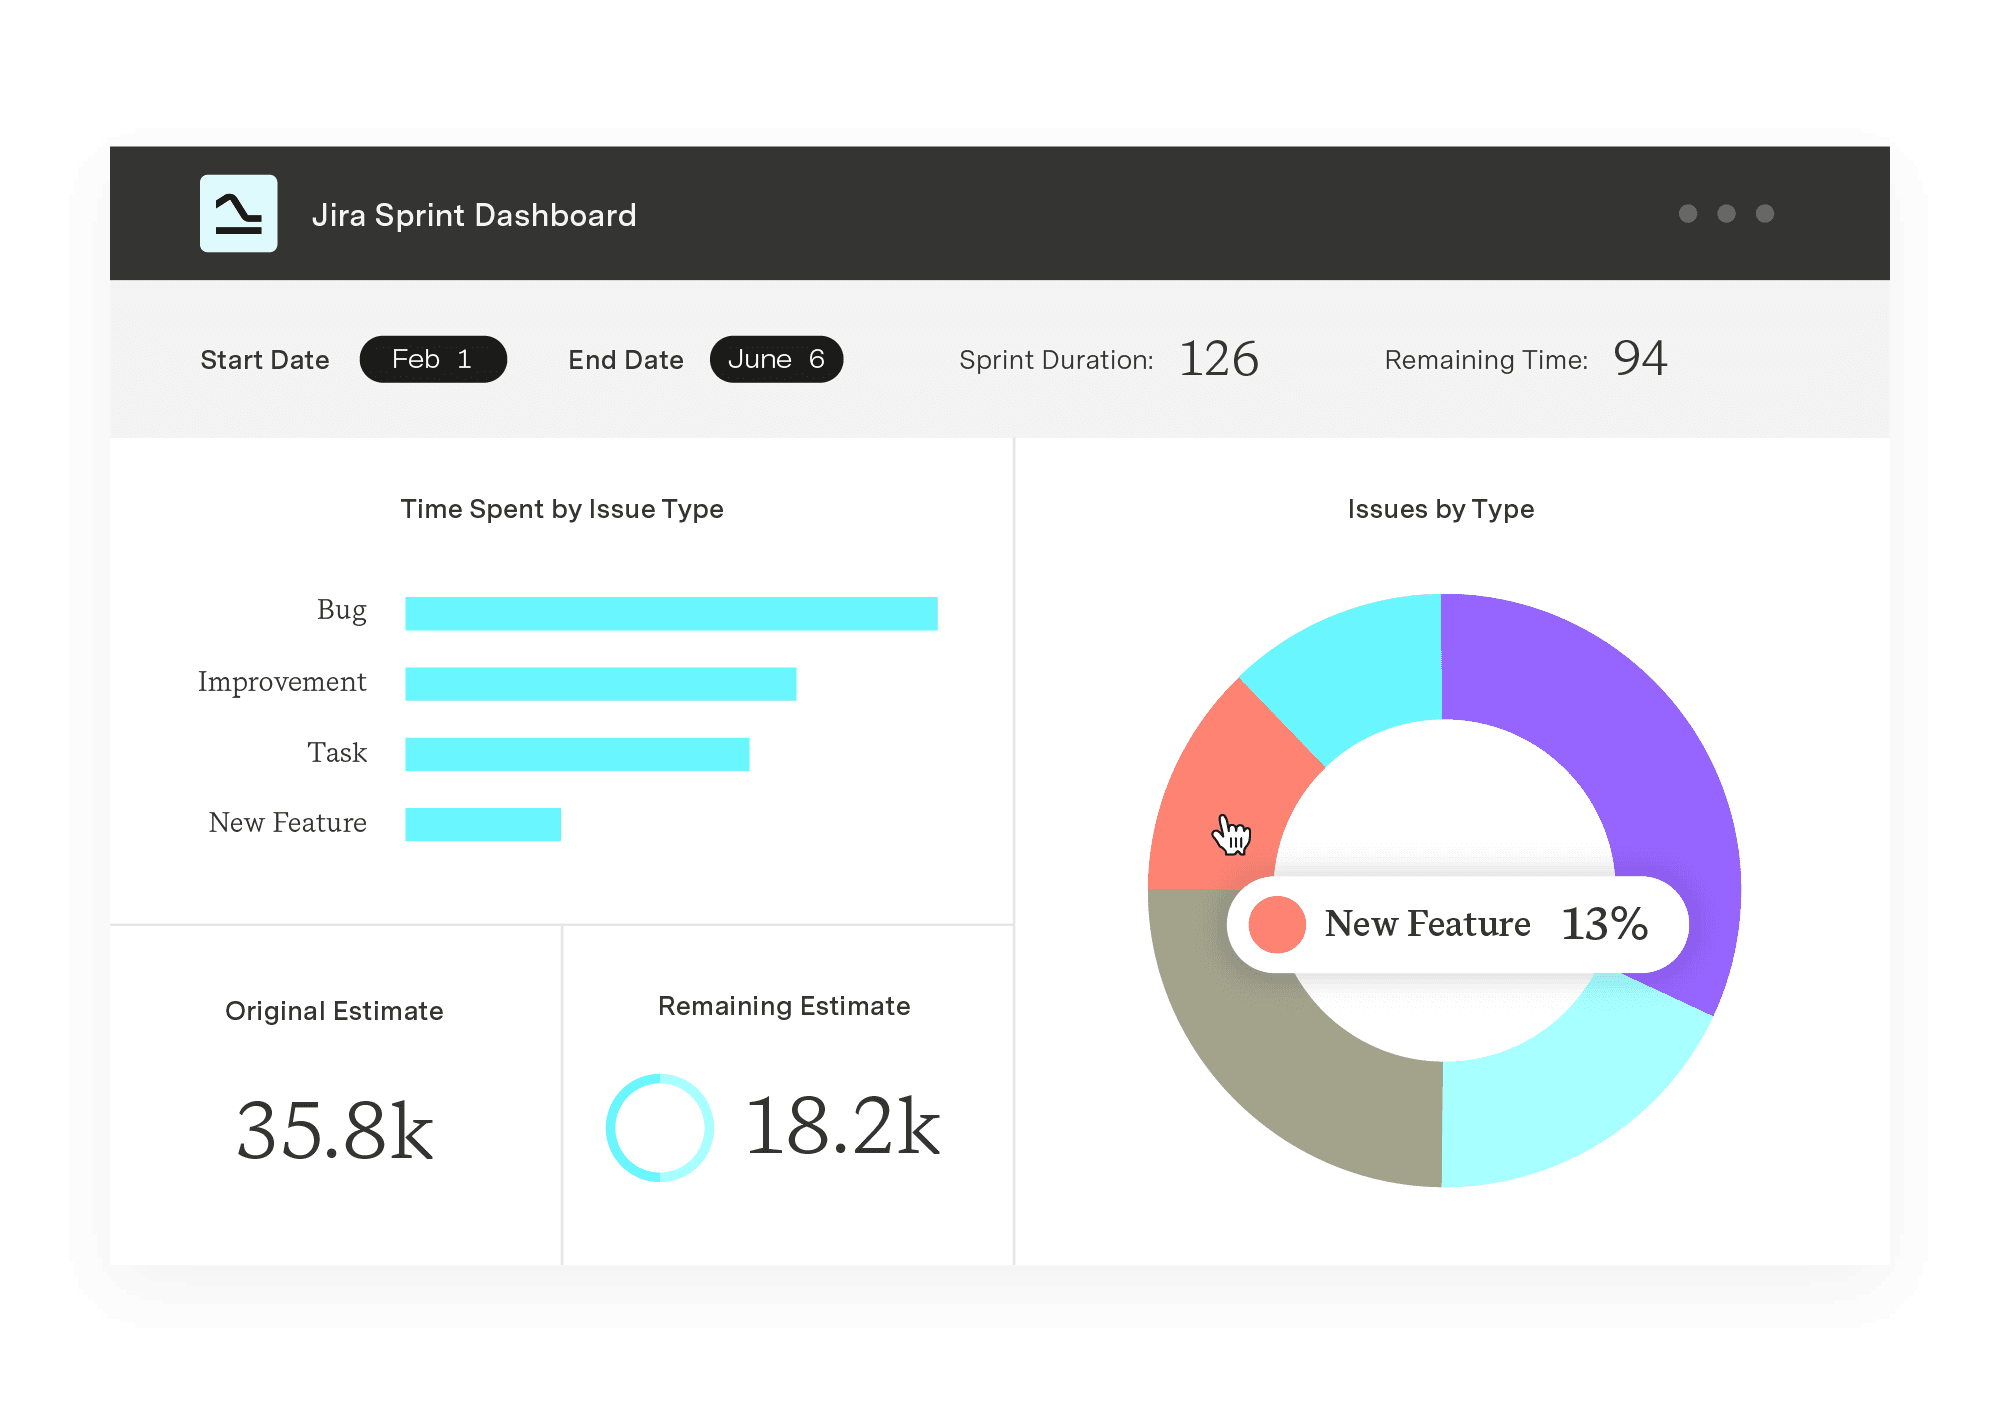
The Sprint Burndown gadget in Jira is essential for your Agile dashboard, showcasing the remaining work and completed tasks within a sprint. Timing is crucial in sprint management, and this gadget visually tracks story points against the completion date, ensuring the team stays on schedule. With Jira Sprint Burndown Gadget, you can easily monitor the progress of the current sprint, observing both remaining work and completed tasks.
The Calendar Gadget visually represents issues and versions, arranged based on their respective due dates, within a calendar format. It provides users with a convenient overview of upcoming deadlines and scheduled tasks. The Jira Calendar Gadget allows users to quickly visualize and manage their project timelines, facilitating better planning and coordination. Additionally, users can interact with the calendar to view detailed information about specific issues or versions directly from the gadget. It enhances project management by offering a clear and intuitive way to track due dates and deadlines within Jira.
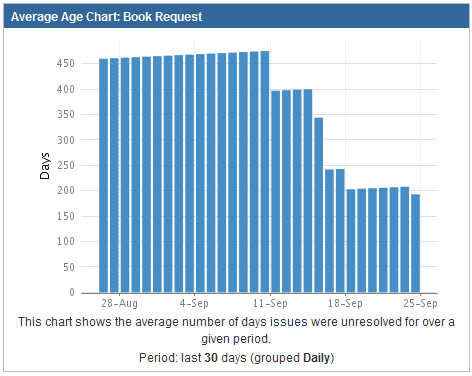
The Average Age gadget in Jira displays the average number of days unresolved issues have been open. It uses a bar chart to visualize this data. To generate this Jira gadget, the system extracts each issue's creation date and resolution date. It then iterates over a configurable list of time periods, such as hours, days, months, or years. For each time period, the report calculates the number of unresolved issues and the total number of days these issues remain unresolved. By dividing the total number of days by the number of unresolved issues, the report derives the average number of days that issues have been open each time. It allows teams to assess the aging of the unresolved problems and prioritize their resolution accordingly.
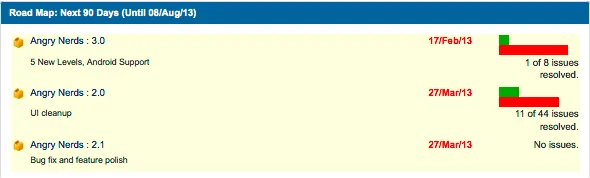
The Jira Roadmap Gadget provides users with a comprehensive overview of project progress by showcasing completed tasks within a sprint and upcoming versions slated for release. This gadget offers a visual representation of project milestones, allowing users to track the status of their initiatives at a glance. Furthermore, users can delve deeper into each sprint or version to access detailed information such as issue statuses, priorities, and assignees. The Jira Road Map gadget empowers teams to plan and prioritize their work effectively, ensuring alignment with project goals and timelines.
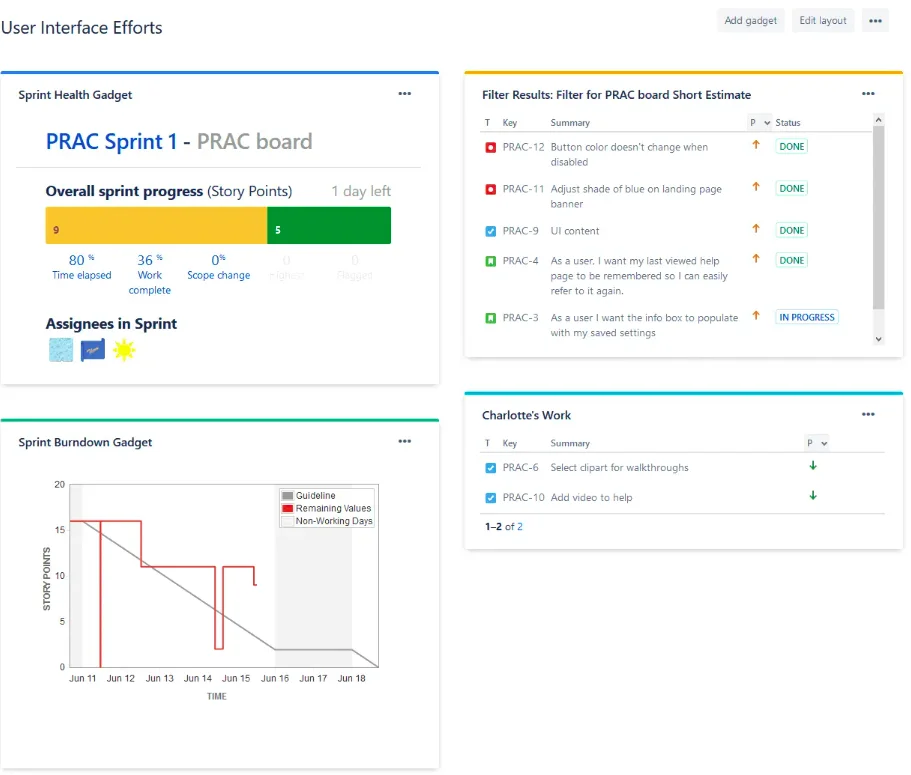
The Sprint Health Gadget in Jira offers a visual snapshot of a sprint's overall health, providing valuable insights for Scrum teams. This gadget presents progress indicators through a color-coded bar, reflecting the status of work items based on the columns in the workflow or board. It enables teams to quickly assess the status of their sprint and identify any potential issues or bottlenecks. Additionally, Sprint Health Gadget highlights scope changes, noting when work items are removed from an active sprint. By offering a clear and intuitive visualization of sprint health, this gadget helps teams make informed decisions and take necessary actions to ensure successful sprint completion.
Jira dashboard gadgets are essential instruments, offering concise glimpses into team progress, reports, and data from Jira projects and issues. These gadgets are highly customizable, empowering users to tailor projects and issue details to meet their unique needs or specific team requirements. Users can explore the full spectrum of available options by perusing the comprehensive list available in the Jira dashboard gadgets directory, ensuring their dashboards are equipped with the most relevant and insightful information.
These gadgets allow users to personalize the information displayed on dashboards or wallboards within Jira applications. From tracking open and resolved issues to monitoring project labels and version reports, the versatility of these gadgets ensures that teams have access to the precise metrics needed for effective project management. Furthermore, managing gadgets on dashboards is accessible to both Jira administrators and users, ensuring that relevant information is readily available while maintaining strict control over visibility based on global and project permissions.
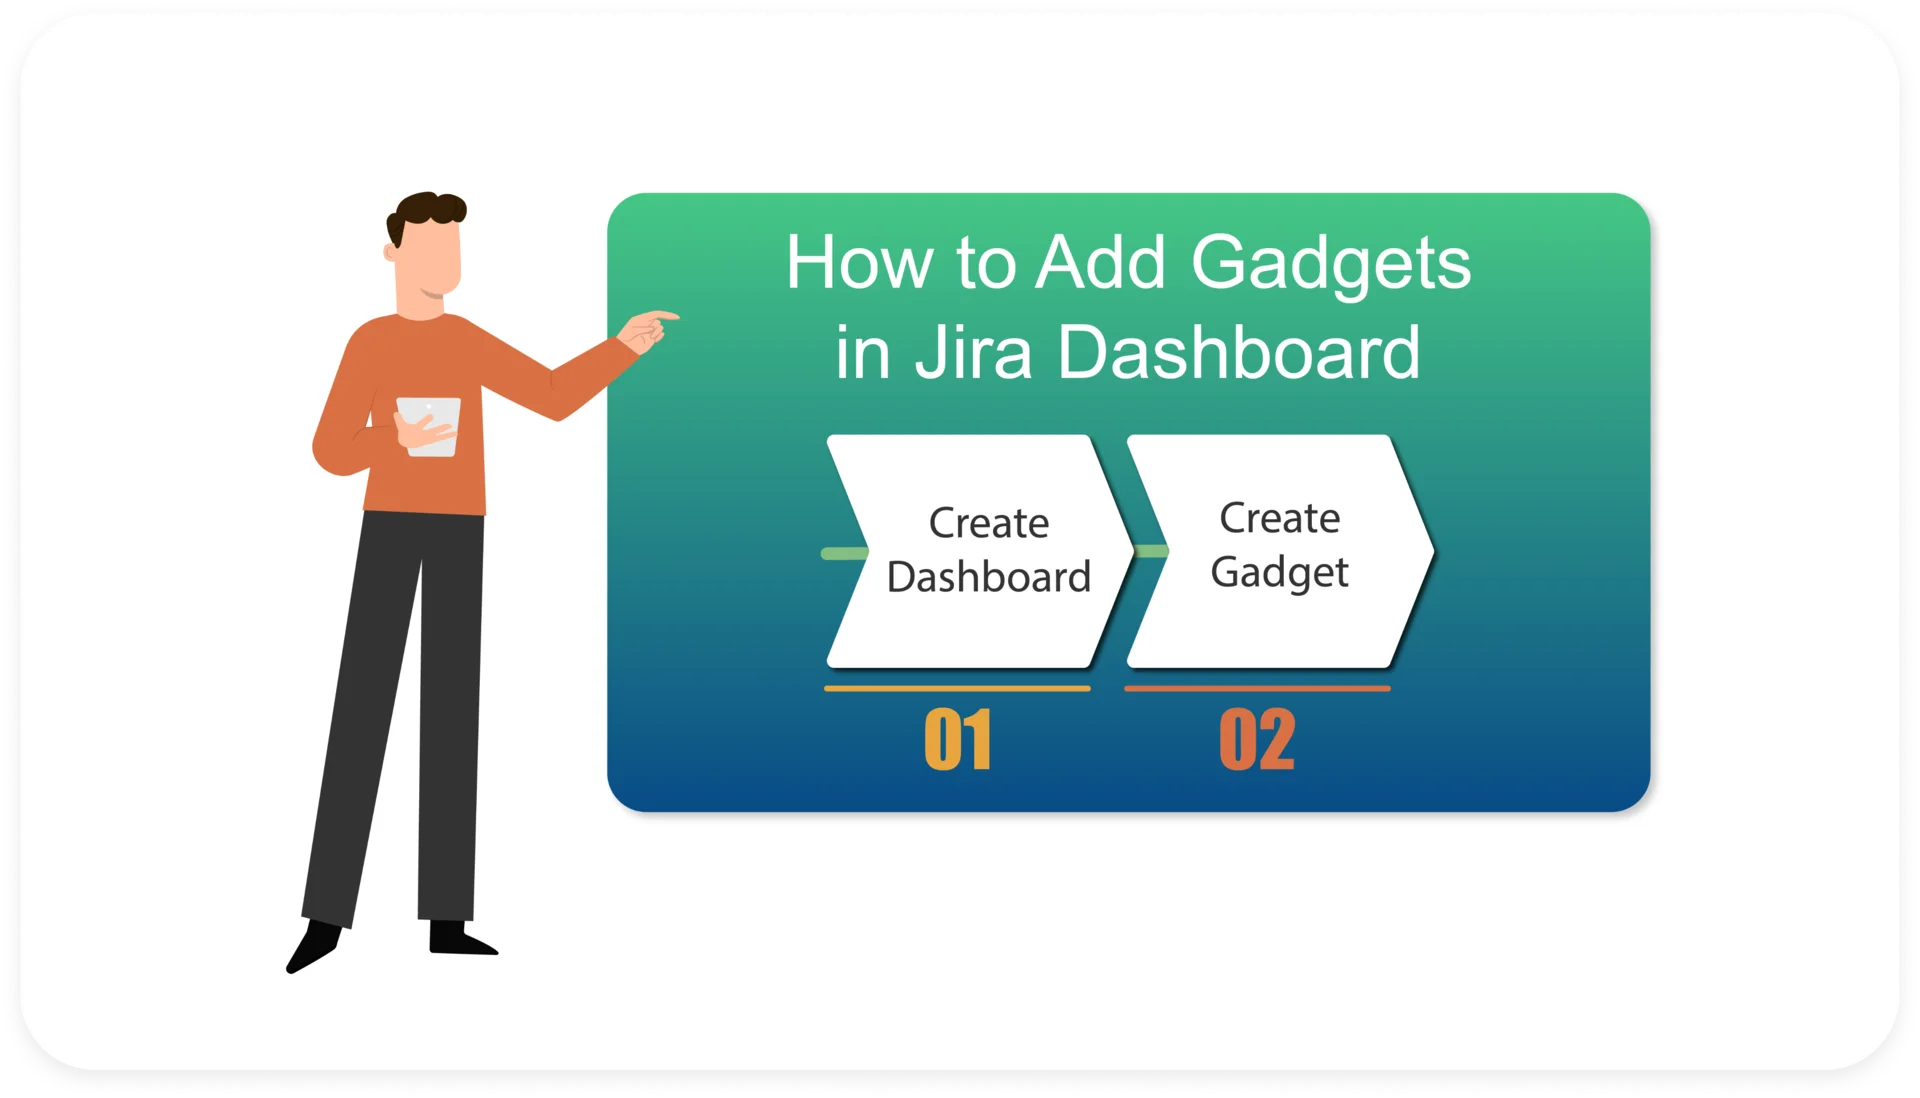
To add gadget to Jira dashboard requires a few simple steps:
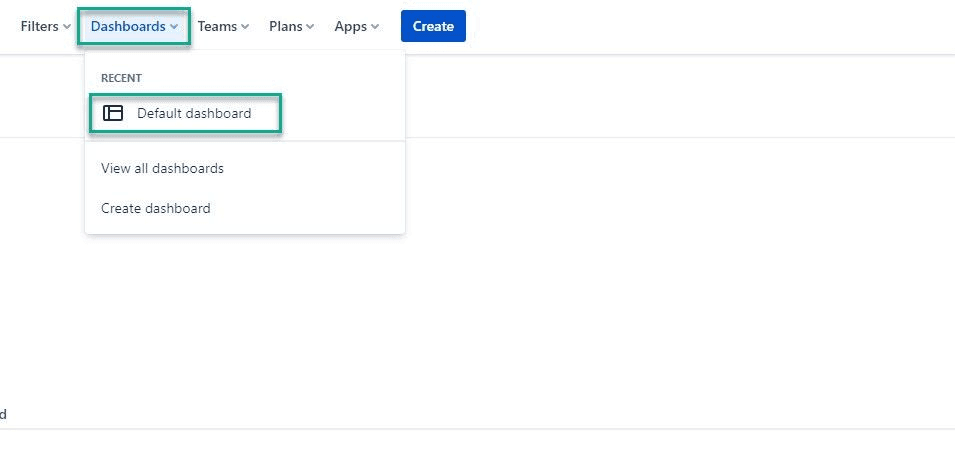
Log in to Jira to see the default system dashboard. Click on the Dashboards menu in Jira and click the Jira icon, followed by Dashboards.
Click "Create dashboard" to start from scratch or "Copy Dashboard" to duplicate an existing one.
Provide a name and description for your dashboard to communicate its purpose to your team.
Complete additional fields as needed and click "Create" to finalize.
To adjust sharing settings for your dashboard, click on the ellipses (...) and select "Rename or share".
Ensure you're logged in as a Jira administrator to modify the dashboard. Also if the dashboard is shared among multiple users or groups, verify your permissions to make modifications. Changes made will be visible to all dashboard users.
Navigate to the dashboard by clicking the "Dashboards" link in the top navigation bar.
Look for the "Add gadget" option on the dashboard interface.
Access the dashboard's Edit mode through the menu options if it's not immediately visible.
Once you've found the "Add gadget" option, use the gadget wizard to browse and select from various available gadgets.
Note that certain restrictions apply to adding gadgets to the directory in Jira Cloud. Refer to Jira's documentation for detailed information on these restrictions.
Following these straightforward steps, you can seamlessly create a gadget in Jira dashboard that is required for your team's specific needs.
While Jira, by default, offers a suite of built-in gadgets, users can access an extensive array of supplementary options through the Atlassian Marketplace, often developed by third-party providers, to create Jira custom gadget to cater to specific operational needs. A significant enhancement to Jira dashboard capabilities comes with introducing Power BI reports as gadgets facilitated by the Power BI Connector for Jira, empowering Jira users to embed Power BI reports directly into Jira dashboards, enhancing data visualization and providing deeper insights into project data.
The Power BI Report gadget enables users to keep track of essential reports using Jira data seamlessly, eliminating the need to switch between various software tools. As Power BI reports are connected directly to live data sources, any changes or updates to Jira project data are reflected instantaneously in the embedded reports. This real-time data synchronization ensures the access to the most up-to-date information. It allows to customize Jira dashboards to be a dynamic, all-encompassing solution for efficient project management, detailed data analysis, and advanced reporting functionalities.
These Power BI gadgets can include interactive visualizations, trend analysis, and performance metrics, providing stakeholders with actionable insights for informed decision-making. It also supports advanced analytics and predictive modeling, allowing users to perform tasks like forecasting and trend analysis directly within their Jira dashboards. By following simple configuration steps, users can add the Power BI Report gadget to their dashboards, unlocking advanced reporting capabilities and promoting agility in project management.
Before embedding Power BI reports into your Jira dashboard, you must first update the Power BI Connector for Jira. Sign in to your Jira Cloud instance and navigate to Dashboards.
Select the dashboard you wish to customize, then click the Edit button.
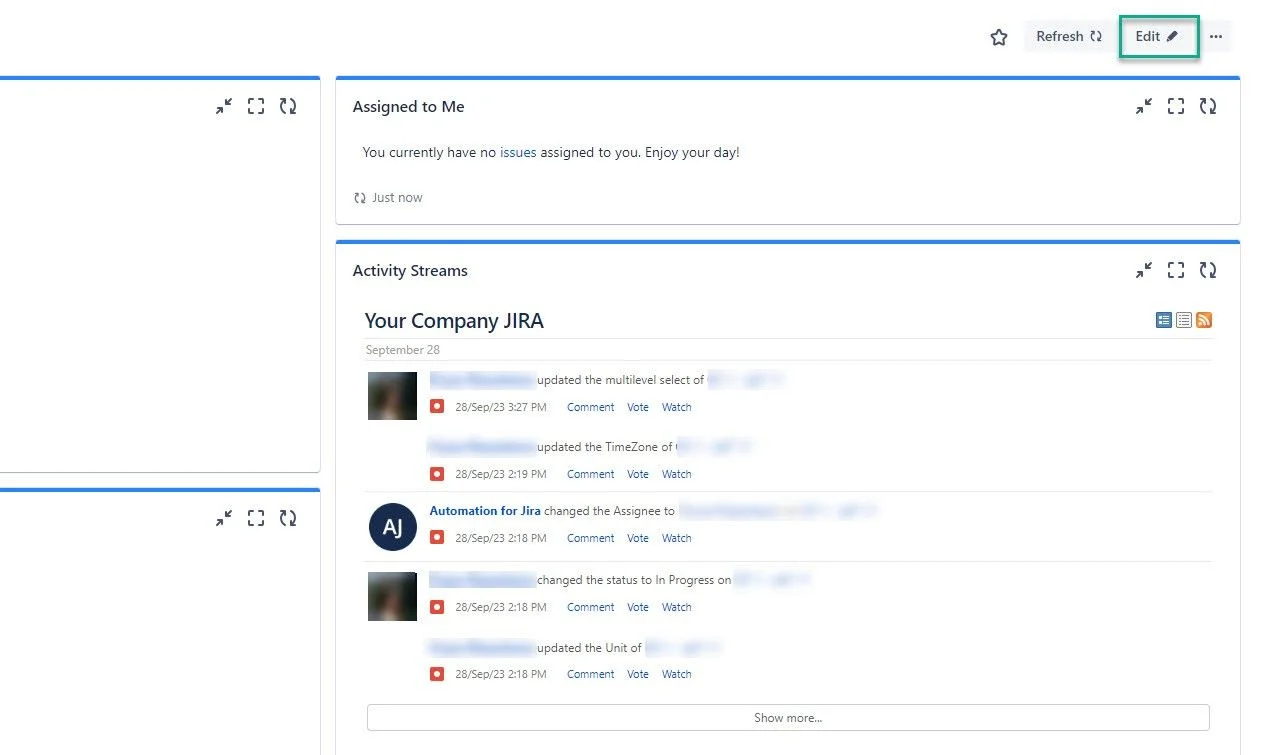
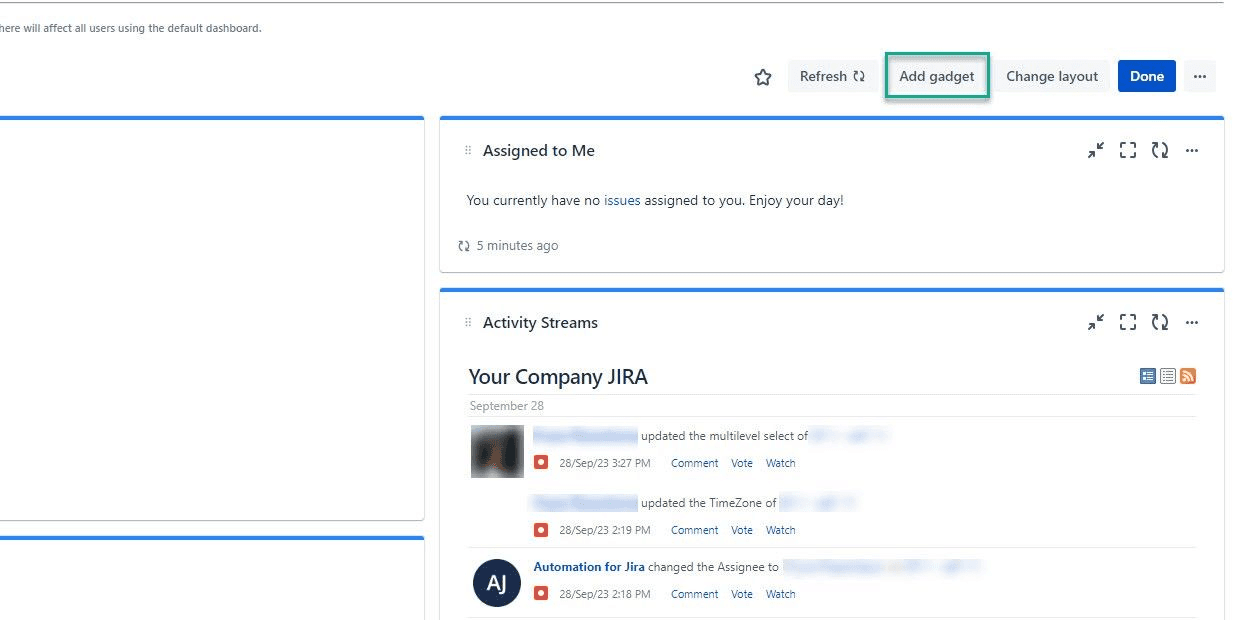
Click on Add gadget in the dashboard menu.
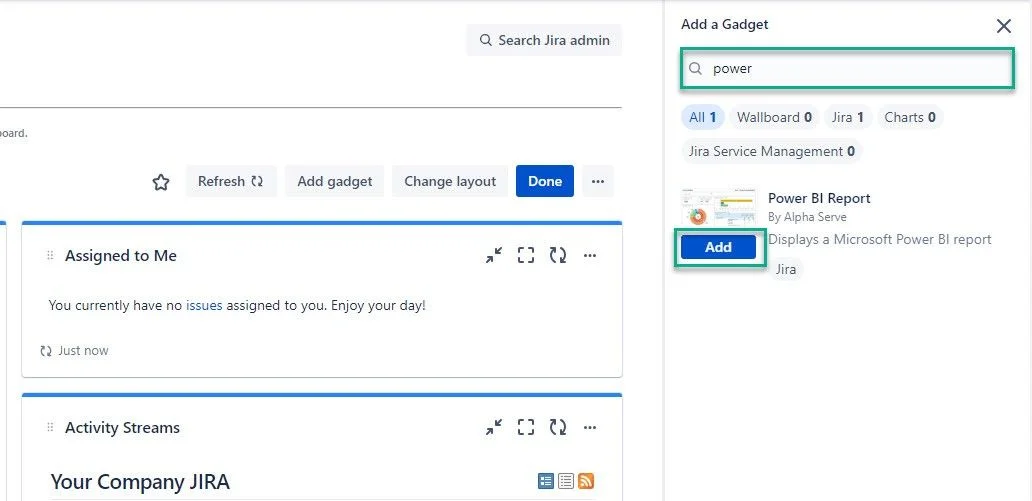
In the search box, type "power" to filter the available gadgets. Look for Power BI Report by Alpha Serve in the search results and select Add.
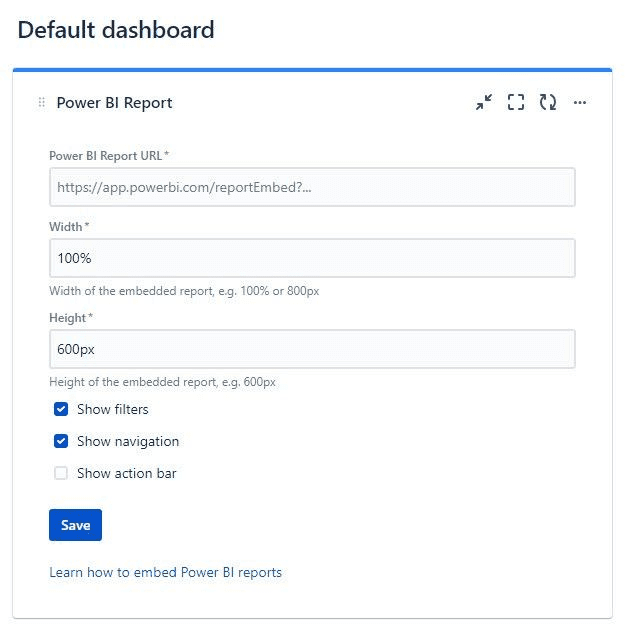
A configuration window for the Power BI Report gadget will appear.
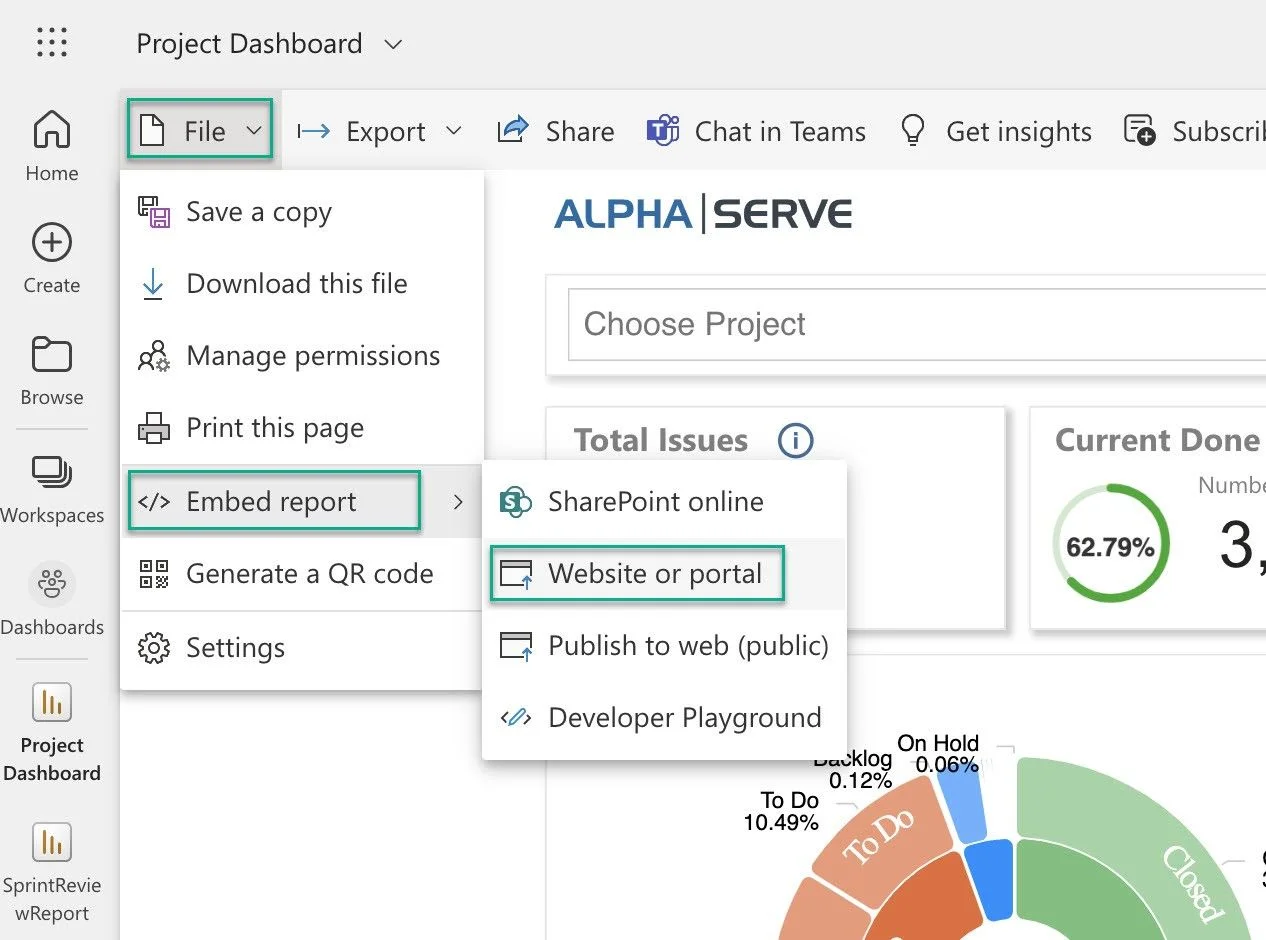
Open Microsoft Power BI Pro and access the report you want to embed. In Power BI, select File, then choose </> Embed report, and finally, select Website or portal.
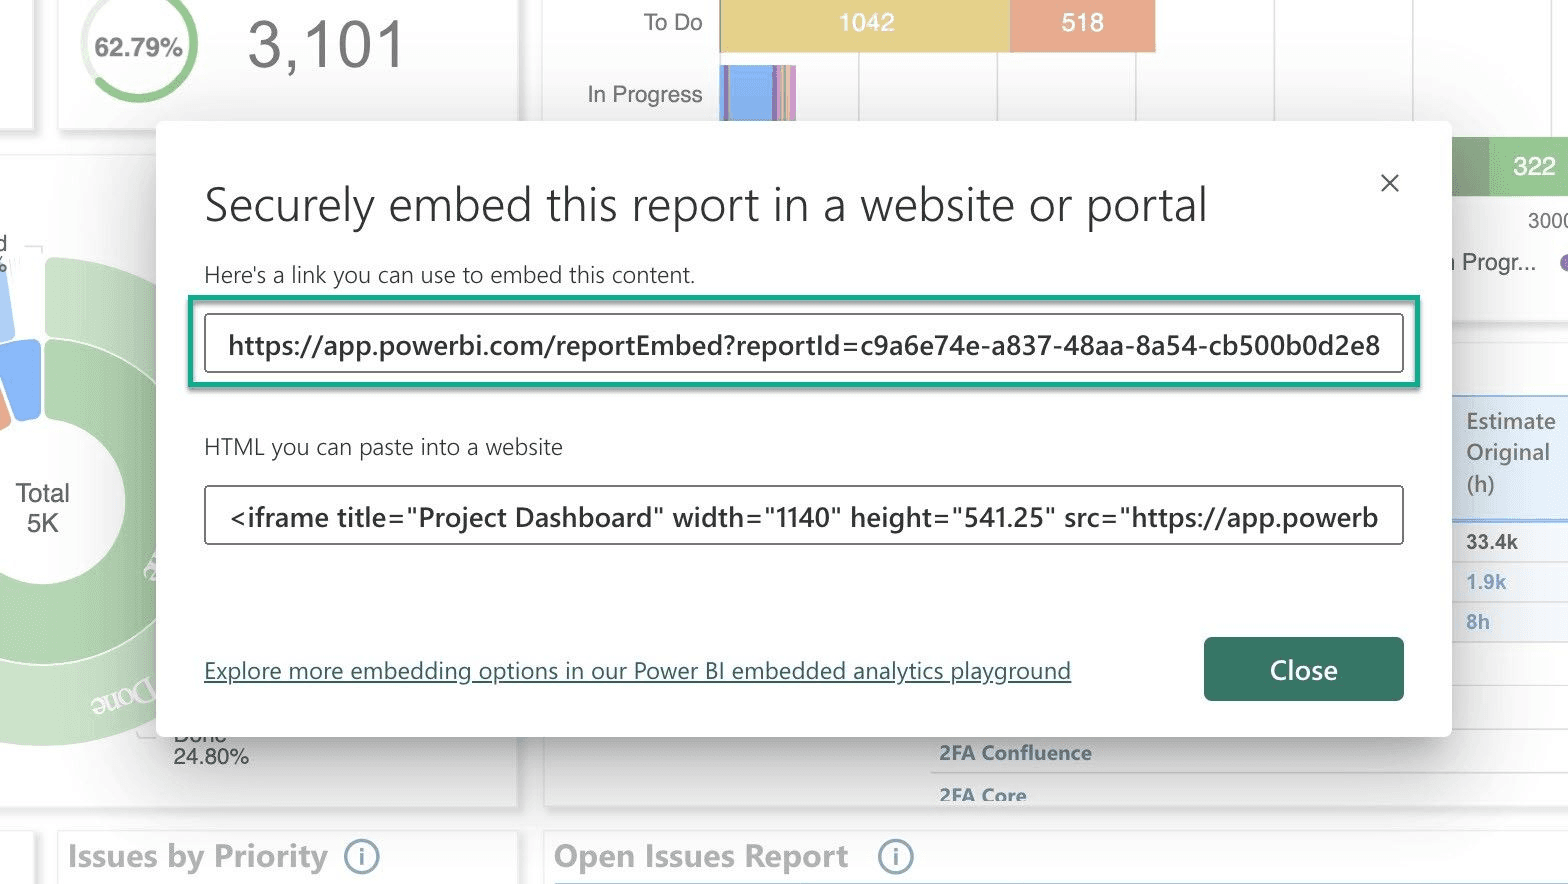
Copy the link provided and return it to your Jira Cloud instance. Paste the copied link into the configuration window's Power BI Report URL field.
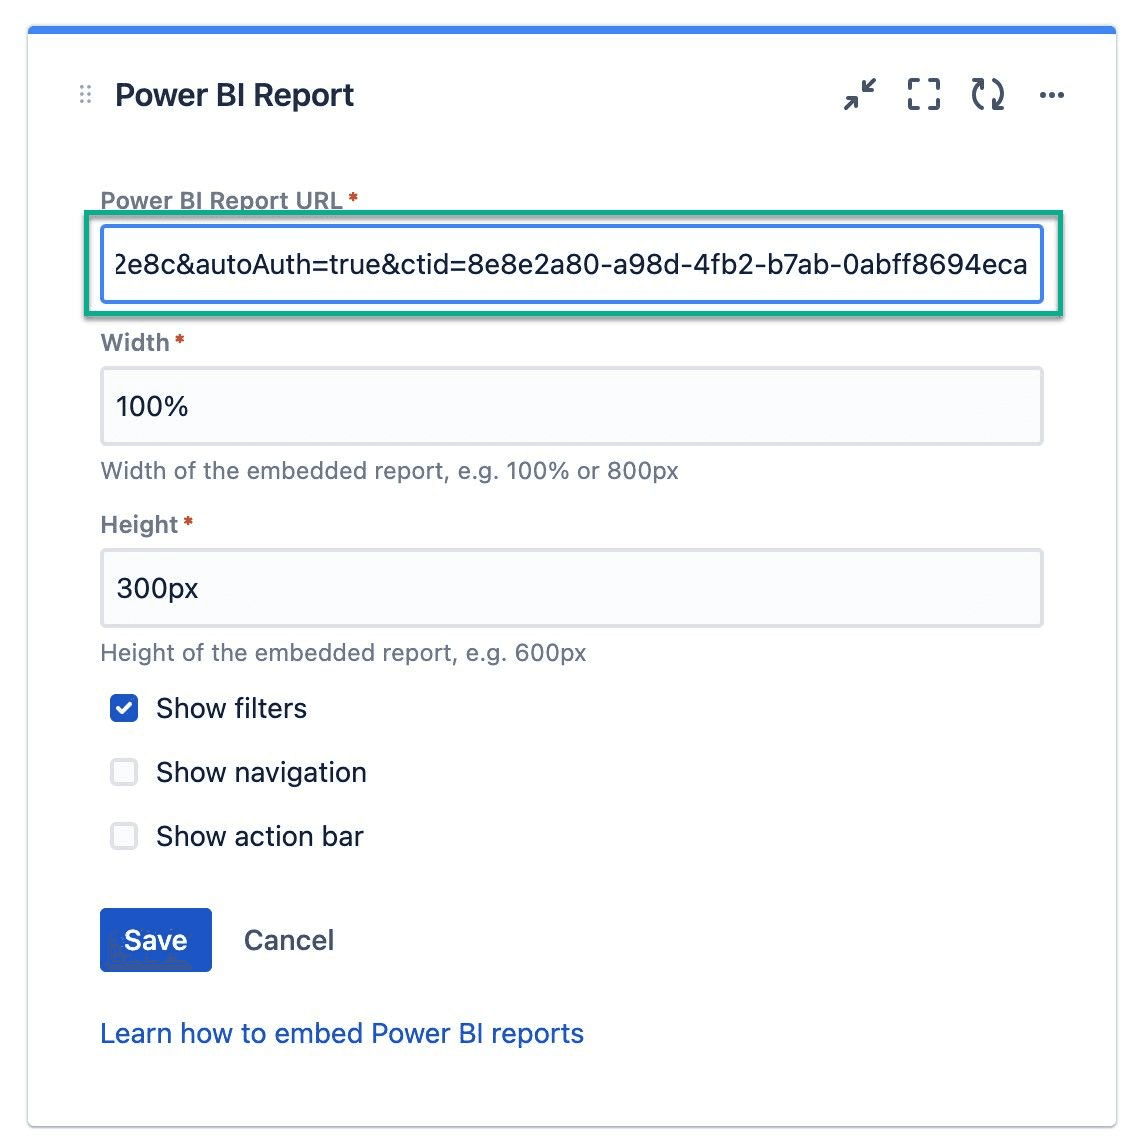
Adjust the width and height of the gadget as needed using the Width and Height fields. Optionally, toggle on Show filters, Show navigation, or Show action bar to display additional features on your gadget.
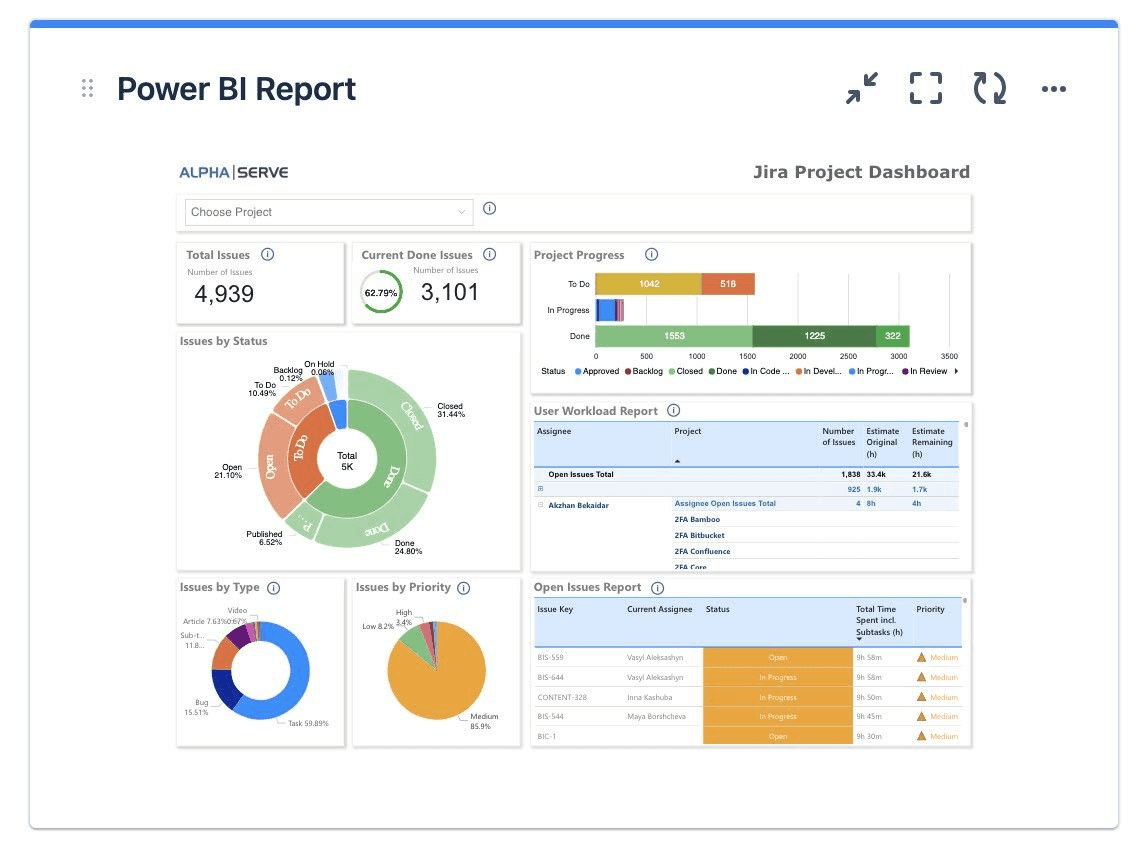
Here's a Jira Power BI dashboard example with a gadget when all features are disabled within the dashboard.
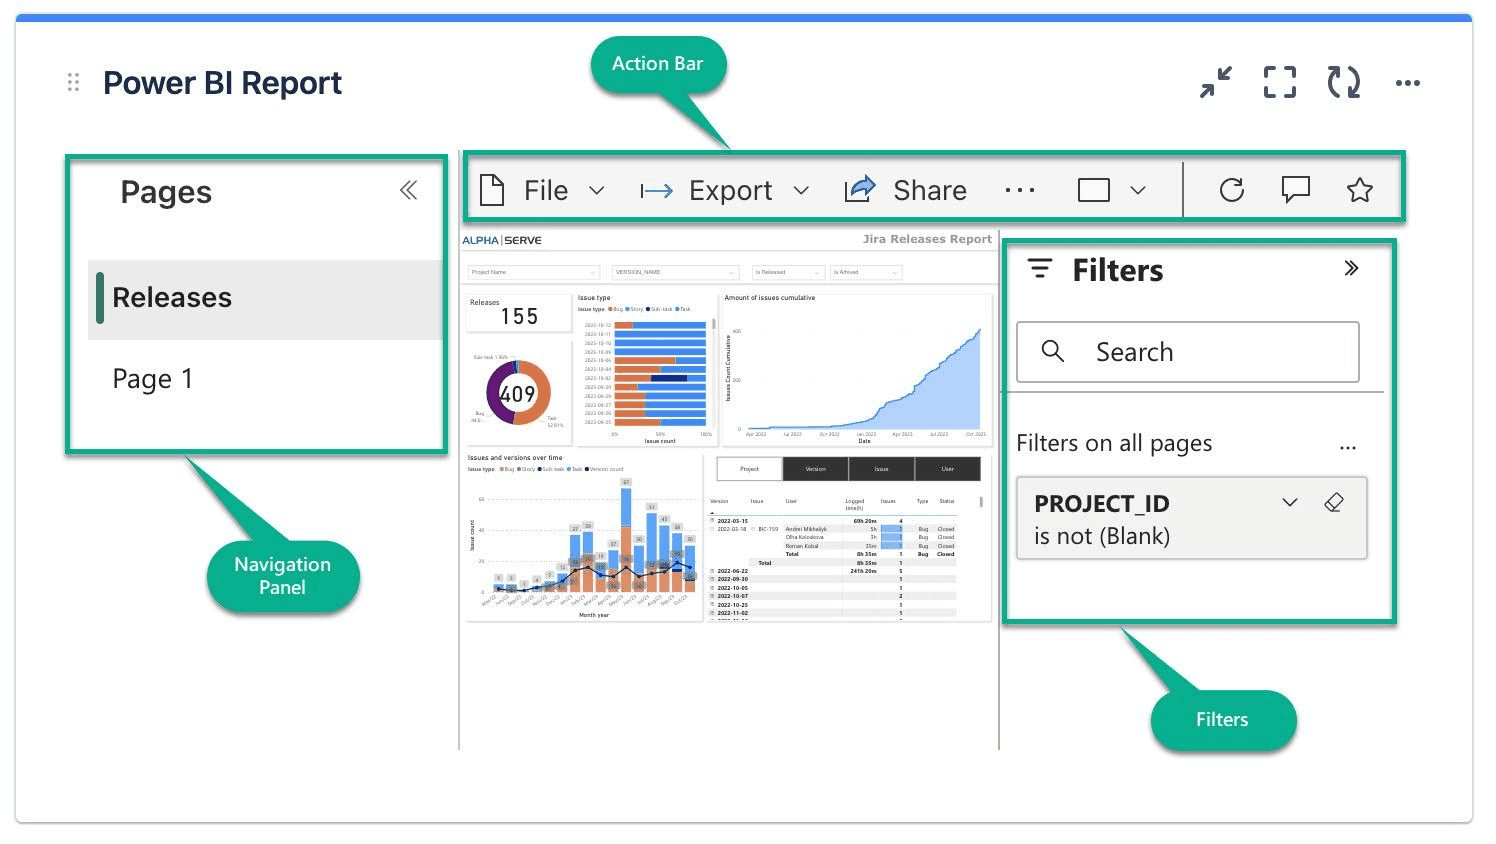
When all features are activated, the Power BI gadget displays with the navigation panel positioned on the left side.
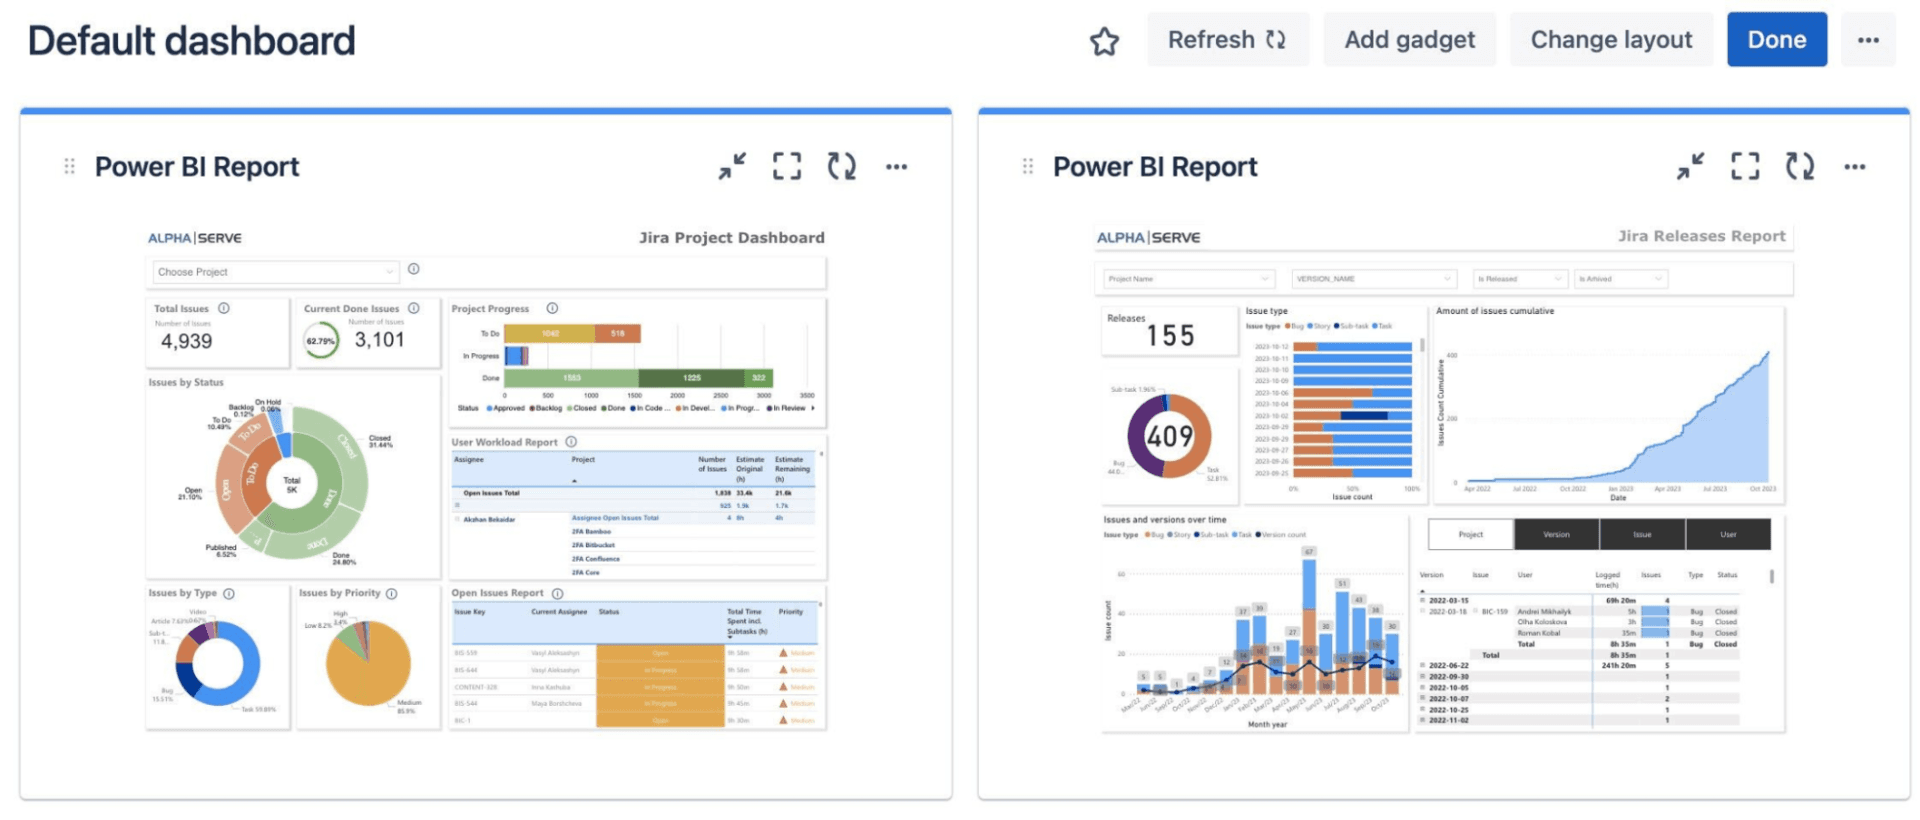
Here's how it appears when you have two Power BI gadgets simultaneously displayed on your dashboard.
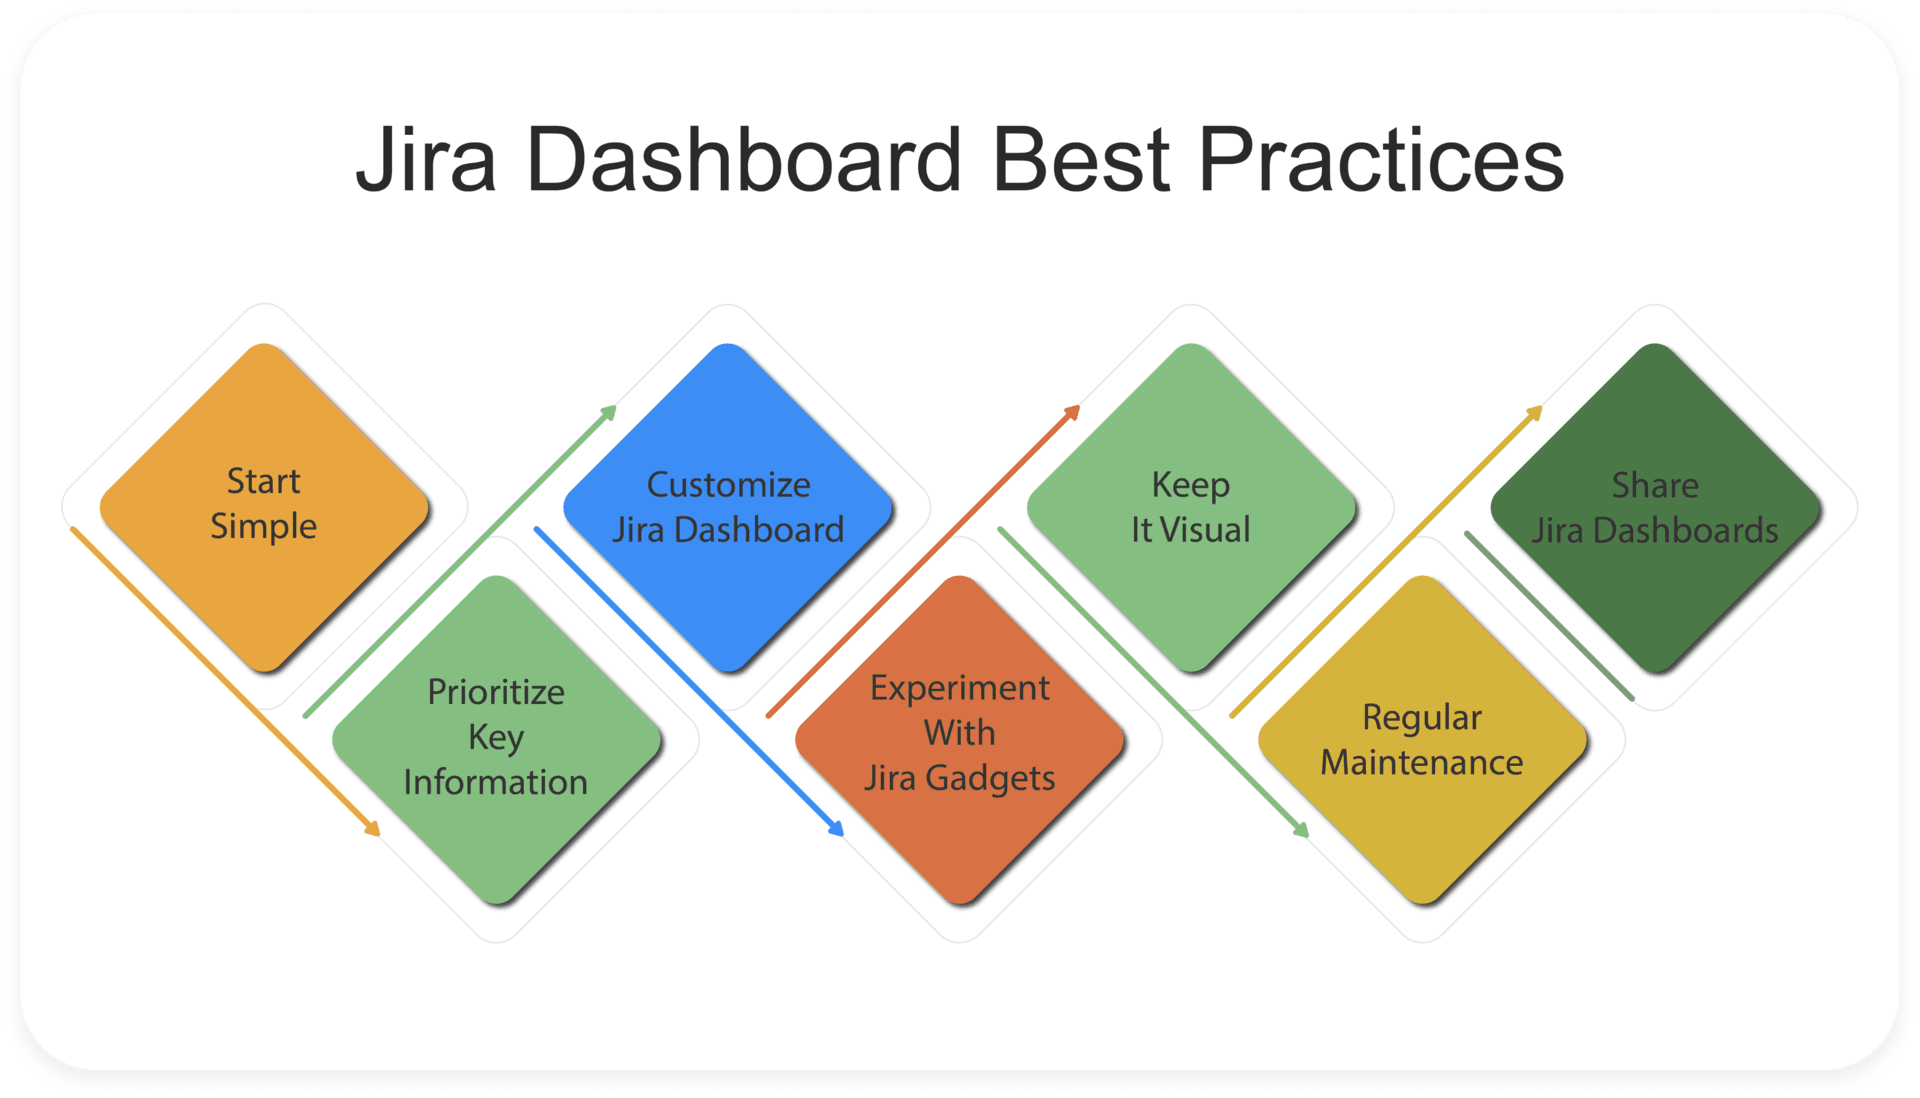
By following these Jira dashboard best practices for optimizing your Jira dashboard using gadgets effectively, you can create a powerful dashboard that enhances visibility, productivity, and decision-making across your projects.
Start with a clean and straightforward Jira dashboard layout. Avoid cluttering your dashboard with too many gadgets initially. Instead, focus on essential metrics and data points that align with your project objectives.
Identify the most critical information that you and your team need to track regularly. Use jira gadgets like "Assigned to Me" to display tasks assigned to individual team members, and "Sprint Health" to monitor the progress of your sprints.
Create a Jira dashboard to display information that is relevant to your specific project or team. Utilize gadgets like "Created vs. Resolved" to track issue resolution rates or "Pie Chart" to visualize issue distribution by status.
Feel free to experiment with different Jira layouts and compare gadgets to determine the best for your reporting needs. Test new gadgets and adjust your dashboard based on feedback and changing project requirements.
Explore and compare gadgets that offer visual data representations, such as charts, graphs, or progress bars. Visual elements make it easier to quickly grasp complex information and trends.
Periodically review and update your dashboard to ensure it remains up-to-date and relevant. Remove any unnecessary gadgets or replace them with more useful ones as your project evolves.
Encourage collaboration by sharing your dashboard with team members or stakeholders. Use gadgets like "Filter Results" to customize views for different audiences, ensuring that everyone sees the information most relevant to them.
Jira gadgets are crucial in optimizing workflow management and enhancing team performance. By strategically configuring gadgets highlighting key performance indicators, teams can swiftly identify bottlenecks, streamline processes, and drive continuous improvement. Integrating Power BI reports as gadgets within Jira dashboards offers a transformative solution for organizations seeking to enhance their project management and data analysis capabilities. With real-time data synchronization and support for advanced analytics, stakeholders can make informed decisions quickly and proactively identify potential risks or opportunities.
Power BI Connector for Jira
Experience a new standard in data integration and reporting. Enjoy quick setup, effortless data export from all Jira products and third-party apps, and instant access to pre-built templates.
Start a Free TrialMeasure how long Jira issues take to close, broken down by status. The resolution time report turns workflow drift into a number you can act on.

Learn the basics of the agile methodology and how to help your team adopt an agile mindset. Find out how agile can benefit your organization.

Agile in a textbook and in implementation are not the same. It takes putting agile theory into practice and optimizing processes within the team.

Discover the importance of production planning. Explore each type and its advantages. You’ll reduce waste, improve margins, and increase efficiency.

Scrum provides a framework for individual teams to collaborate. But how can multiple teams use scrum together? The answer is Scrum at Scale.

Learn how to run a strategic feasibility analysis to assess project viability. Align initiatives with business goals for successful product launches.
You’ve spent lots of time and energy developing a strategy for your business. Put it to work with a strategy implementation plan that engages everyone

Get your discount for Tempo Collections – a curated bundles of award-winning apps designed to help you scale step by step on your SPM journey.

A digital billable hours tracker helps ensure you maintain accurate records of your team’s hard work.