Establish alignment between stakeholders and team members with an essential source of informational truth. Learn to write an effective project brief.

Creating a comprehensive cost tracking report for Jira can provide invaluable insights for project management, helping teams monitor budgets, optimize resource allocation, and ensure financial transparency. With Tempo Cost Tracker, you can easily track costs associated with your Jira projects. But to visualize and analyze this data effectively, integrating it with a powerful tool like Power BI is key.
In this article we will dive you in the importance of Tempo Cost Tracker and guide you into creating a Tempo Cost Tracker Report for Jira using Power BI Jira Connector.

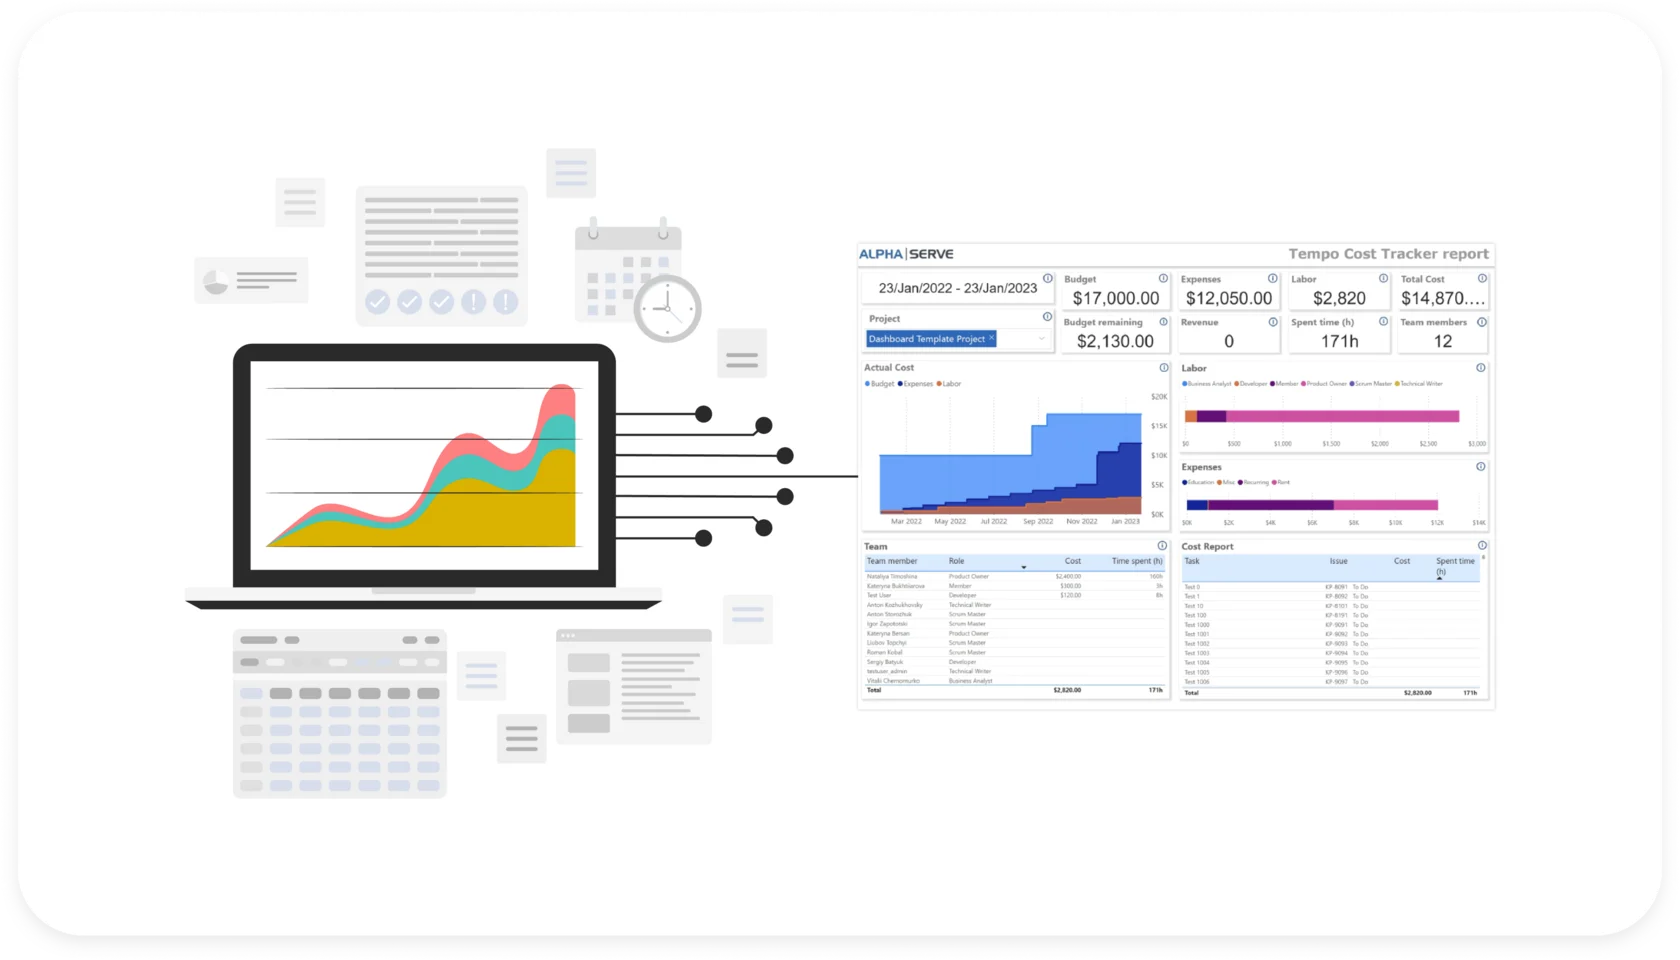
Cost tracking is a key element in understanding of a definite project and overall financial performance of the organization. Thanks to an easy and quick identification of the areas you expect to spend money, it allows you to keep projects under control. Cost tracking also gives users information about the expected expenses and compares them with actual expenses that allows them to monitor fluctuation in cash flow and budget.
Cost Tracker Tempo is a financial control application that integrates with Tempo Timesheets to track a project's costs and revenues in real time. The application automatically collects data on hours recorded by the team, eliminating the need to manually enter data into separate spreadsheets and maintaining order. Tempo Cost Tracker allows you to monitor budgets, milestones, labor costs, fixed and recurring costs, billable and non-billable time, revenue and profitability. The data collected can be used to manage budget allocations accurately and produce detailed estimates. Features include sharing of financial data, KPIs, budgets, expenses, and progress tracking. In addition, Cost Tracker also provides an application programming interface (API) to integrate with other applications, add new features, and customize workflows.
This app provides users with solid strategic portfolios based on aggregated budget, costs, revenue, and scope. The Cost Tracker by Tempo can be integrated seamlessly into company’s setup and pull detailed cost tracking data from Tempo. This app is essential for gathering and analyzing cost data effectively within Jira Power BI dashboard. Tempo Cost Tracker ensures users make informed financial decisions, adapt to unforeseen challenges, optimize resources, and ultimately achieve goals on time and within budget.
A Tempo Cost Tracker Report is a crucial tool for project management and financial oversight, especially in organizations that need to monitor various cost changes associated with projects or departments. Here are key metrics that can be included in such a report:
Total cost to date associated with a project in a defined period of time gives a comprehensive overview of the financial responsibility and helps to keep budget adherent.
Revenue and expense shows detailed information about revenues and expenses of a defined period of time. The comparative analysis can show both planned and actual budget and spending. This highlights discrepancies, helps to track the financial performance and enables to take corrective action.
Cost breakdown by the category divides costs into specific categories such as labor costs, material costs or overhead costs to get deeper insights and understand where the money is being spent, allowing to provide targeted cost-saving measures.
Return on investment (ROI) calculated by comparing net profit to the costs involved in generating that profit allows to indicate the profitability of a project and whether resources are being effectively invested.
Cost per project/activity helps to evaluate the financial viability of projects and allocate resources effectively based on performance metrics.
Forecasted costs vs. actual costs compare anticipated future costs based on estimates against what is being actually spent as the project progresses and allows to improve future cost predictions.
Resource Allocation shows how the financial resources are distributed among various projects, teams, or departments to ensure optimal use of resources and show the potential underfunded projects.
Cost trends over time analyzes data over different time periods and identifies trends or patterns in spending to help forecast future costs, identifying seasonal expense variations and understanding changes in project scope.
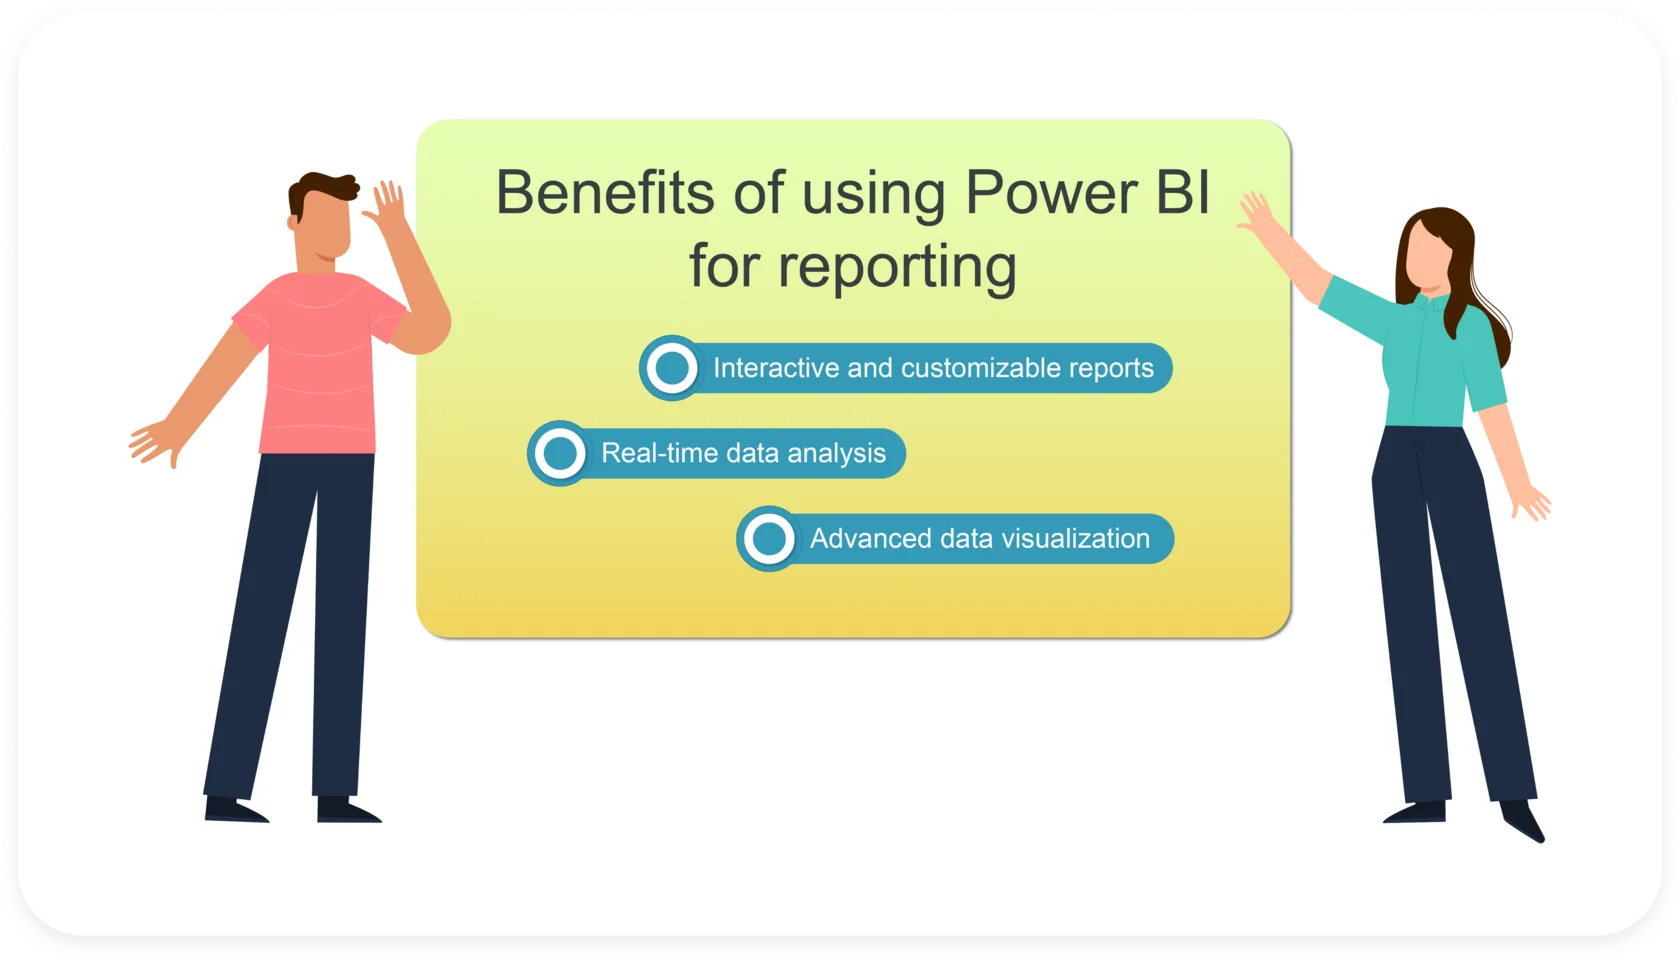
The Tempo Cost Tracker Report is crucial for project management and offers a clear and easy-to-understand financial overview for Jira projects, providing a comprehensive division of costs for each task or team member and allowing to track expenses, budget, revenue and labor costs. Here are some benefits of using Power BI for reporting:
Power BI offers users interactive dashboards and reports and presents data insights in a clear and coherent way. Data visualization is an important piece of the company’s performance, allowing users to understand and act on data insights. It offers a wide range of visualizations such as bar and column charts, line and area charts, pie charts and donut charts, scatter charts and bubble charts, and maps and tables to present data.
Power BI offers different dashboard and report options, which are not only interactive but can be personalized to a great extent. Users can explore data at different levels of detail, use cross-filters and slicing to filter data by various parameters. They can also save the current status of the report page through the bookmarking feature and easily switch between views. Creating dashboards and reports is a way easier and more accessible with Power BI. These interactive visualizations and dashboards present complex information in an intuitive way.
In Power BI dashboards and reports are updated in real time with the latest data from the data source, providing real-time insights that can radically transform decision-making in dynamic business environments. This feature alone translates into many benefits: time savings, cost reductions, increased productivity and improved decision-making, to name a few. It is crucial for industries like finance, retail, and manufacturing, where immediate decisions are essential.
Power BI offers powerful data analytics with a wide variety of data source integrations. These integrations allow organizations to leverage data from a vast number of sources, resulting in comprehensive and statistically accurate reports. The range of integrations is extensive and continues to expand, with frequently updated and supplemented data sources. The Power BI service enables connections to multiple data sources, and with this wide range of data source integrations, Power BI becomes an essential tool for organizations seeking to analyze data from diverse sources and generate comprehensive reports.
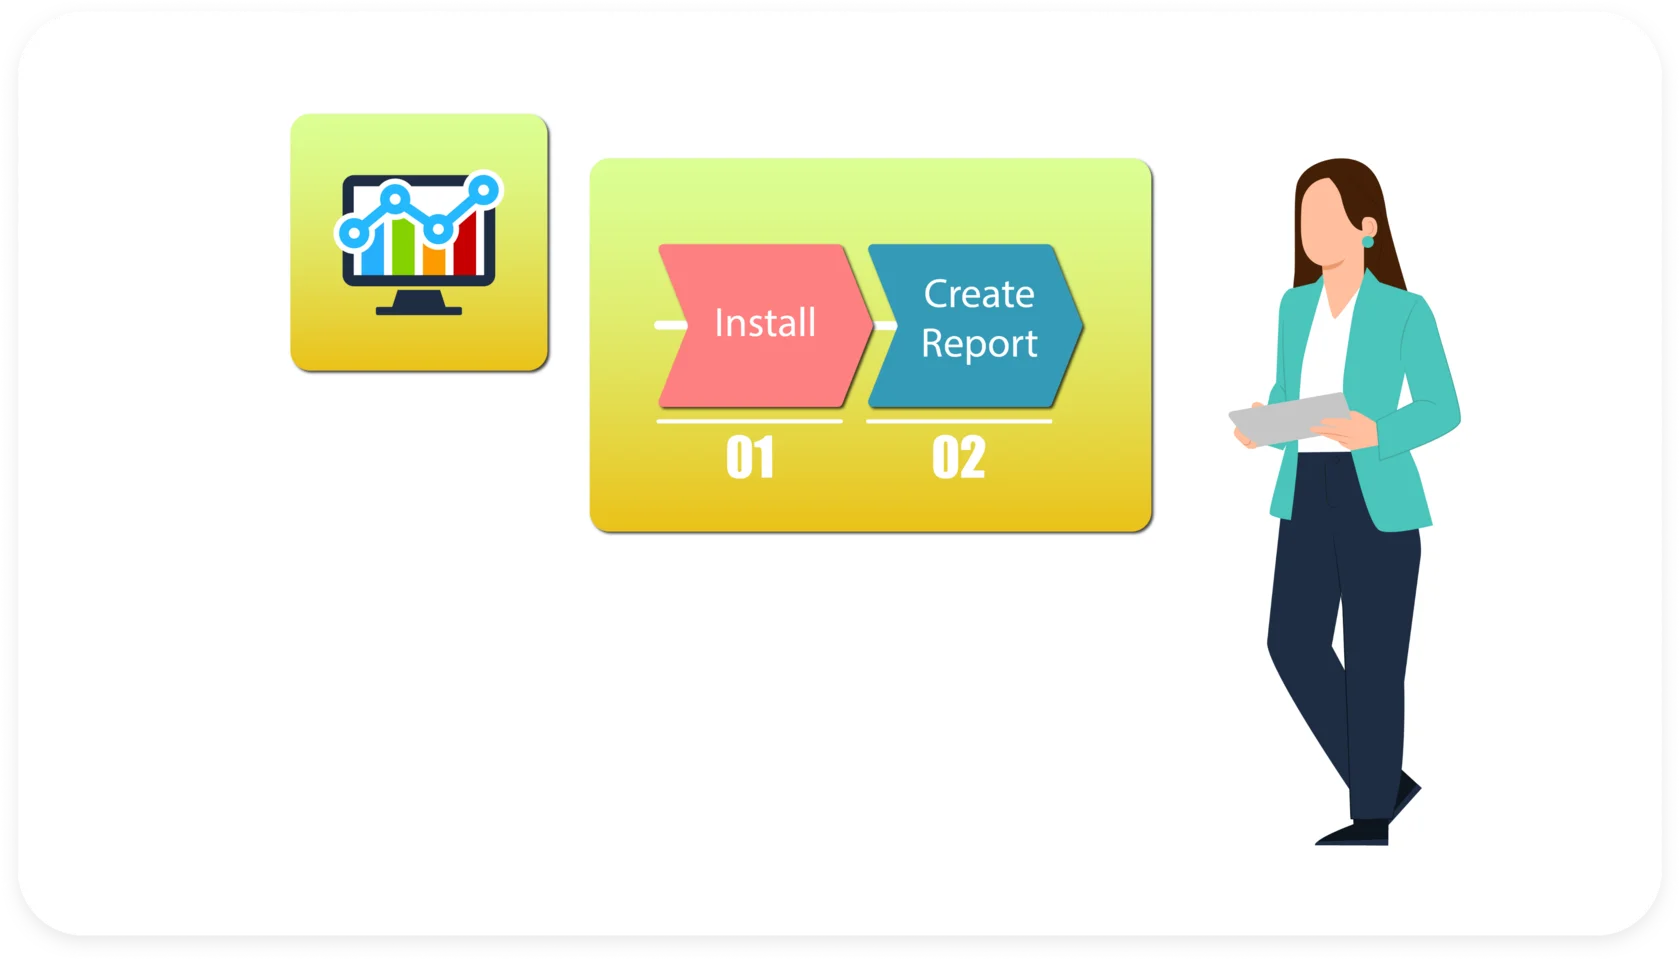
The Jira to Power BI integration allows to align strategic objectives, streamline workflow and empower teams. Creating a Tempo Cost Tracker Report for Jira in Power BI involves several steps.
Here’s a step-by-step guide to help you through this process and make the most out of it.
The Power BI Connector for Jira allows to directly integrate data between Jira and Power BI platforms. This permits users to manage and analyze data promptly. This connector offers a lot of benefits, for example data security and permissions management to keep data secured. Moreover, you don’t need any additional costs or resources to make it run while handling big data volumes.
Power Bi Connector for Jira
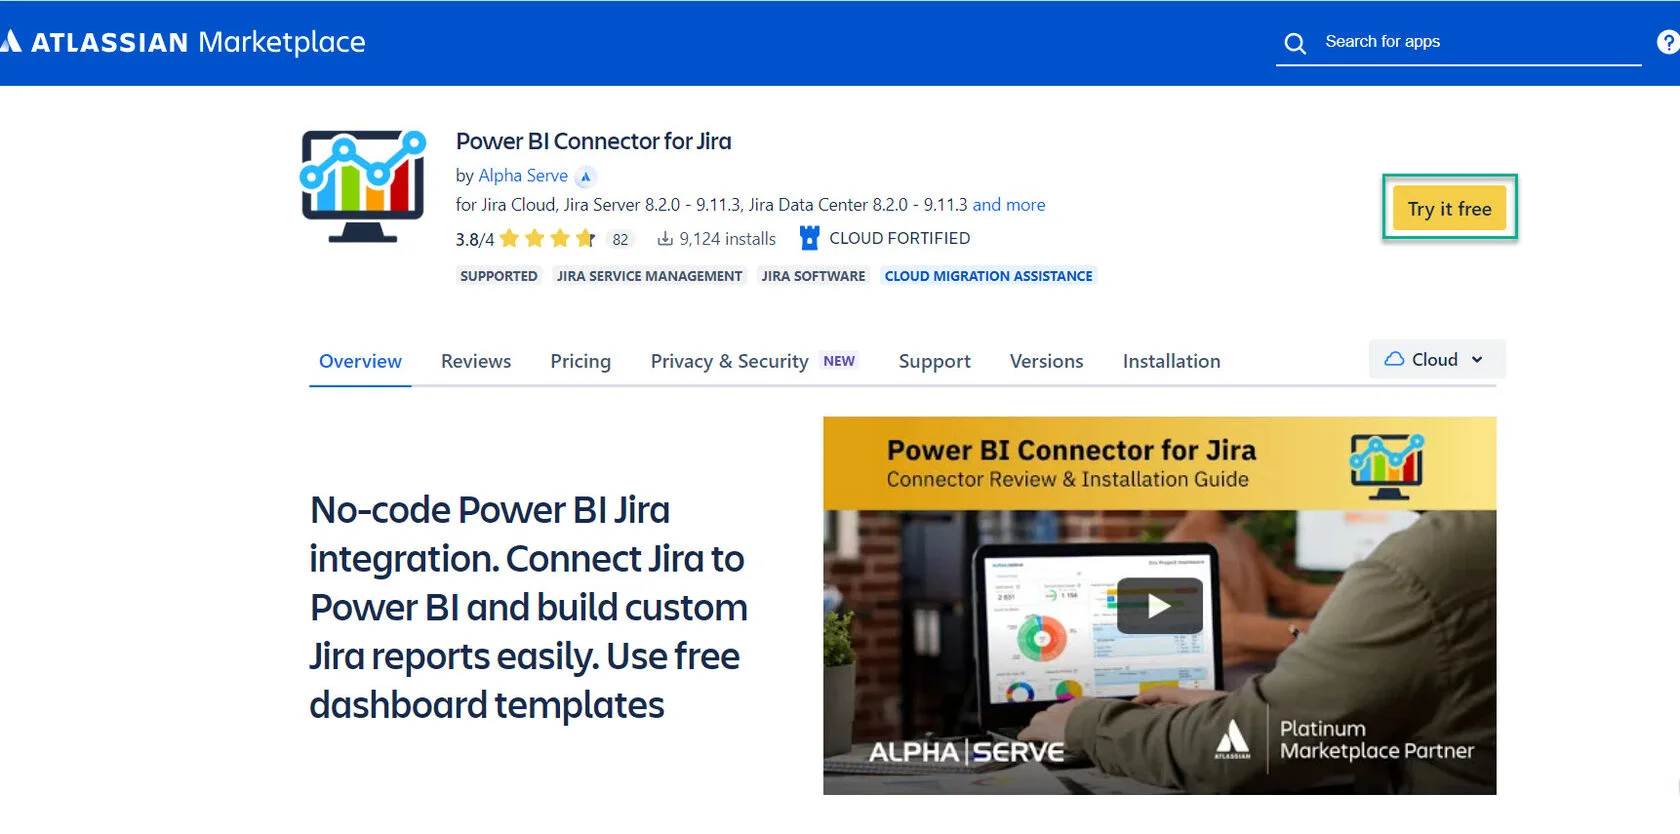
Before exporting data, the Jira Power BI Connector has to be installed from the Atlassian Marketplace. There are two option to do it:
To install the Power BI Connector for Jira, you can go to the Jira cloud instance and navigate to the Apps section. Click on “Explore more apps”, type “Power BI Connector for Jira Alpha Serve” and select it from the results in the submenu.
The second possible and easier option is to go directly to the Atlassian Marketplace and click on “Try it free” button. Proceed to your Jira instance for installation selecting “Start free trial”.
Once the installation is completed, you can easily access the Power BI Connector in you Jira Cloud instance.
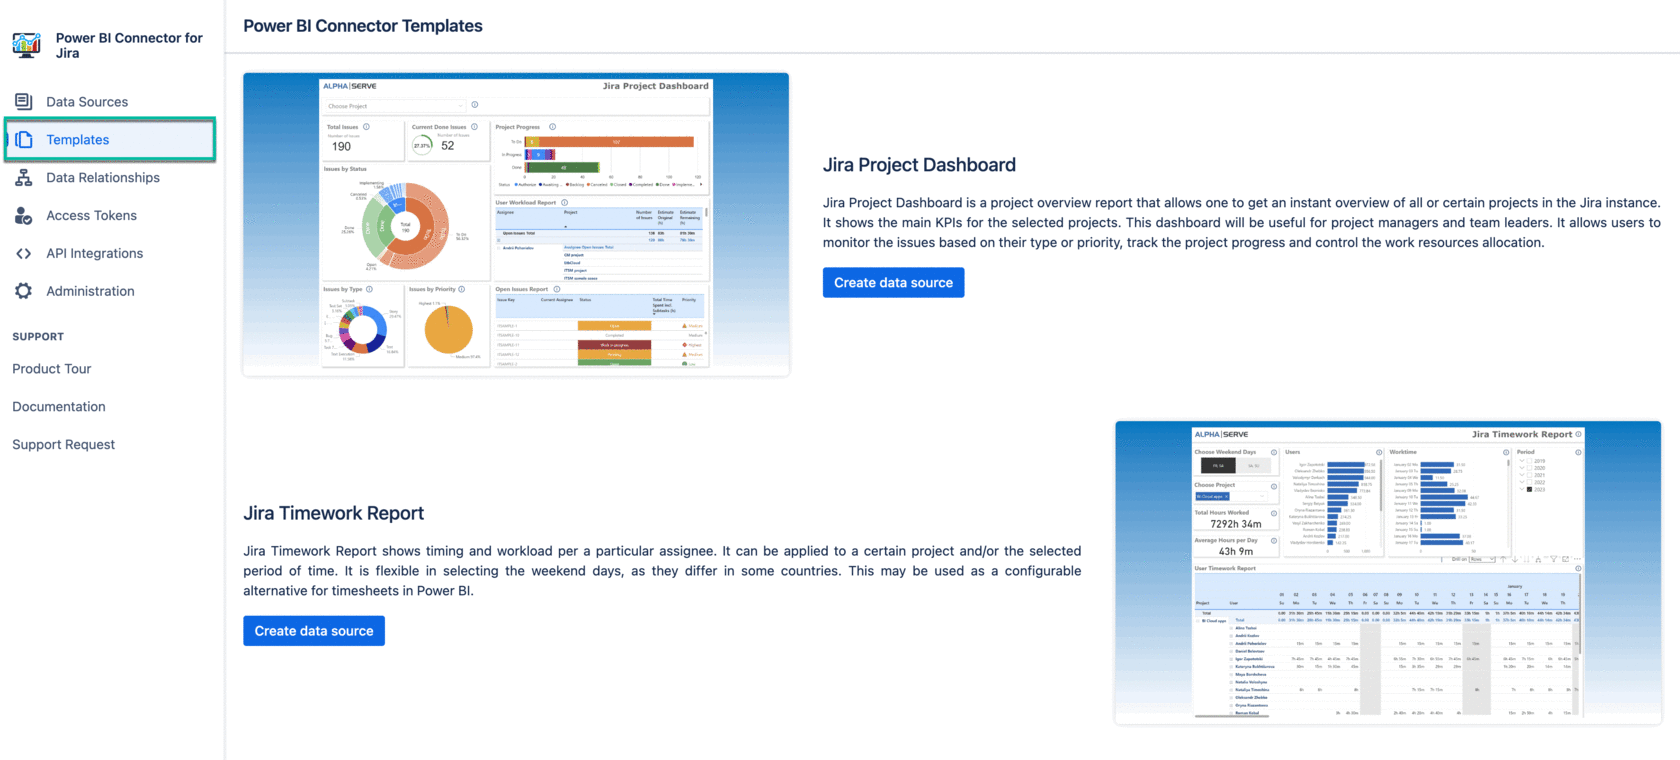
Navigate to the Templates tab. Find the template you want and click Create data source next to it.
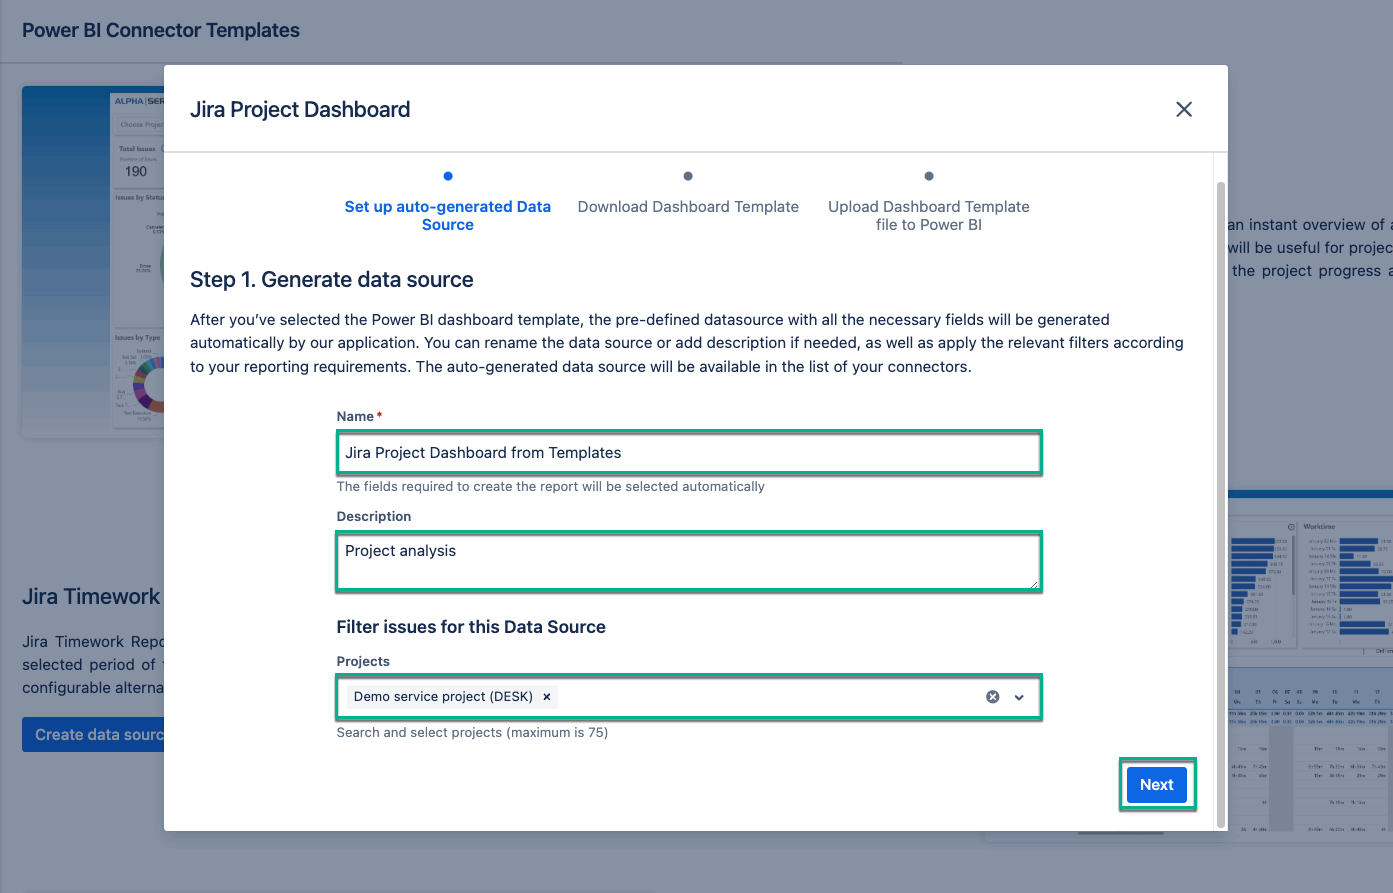
Enter your data source's name in the Name field. Optionally, you can add a description and apply a filter by projects. Click Next.
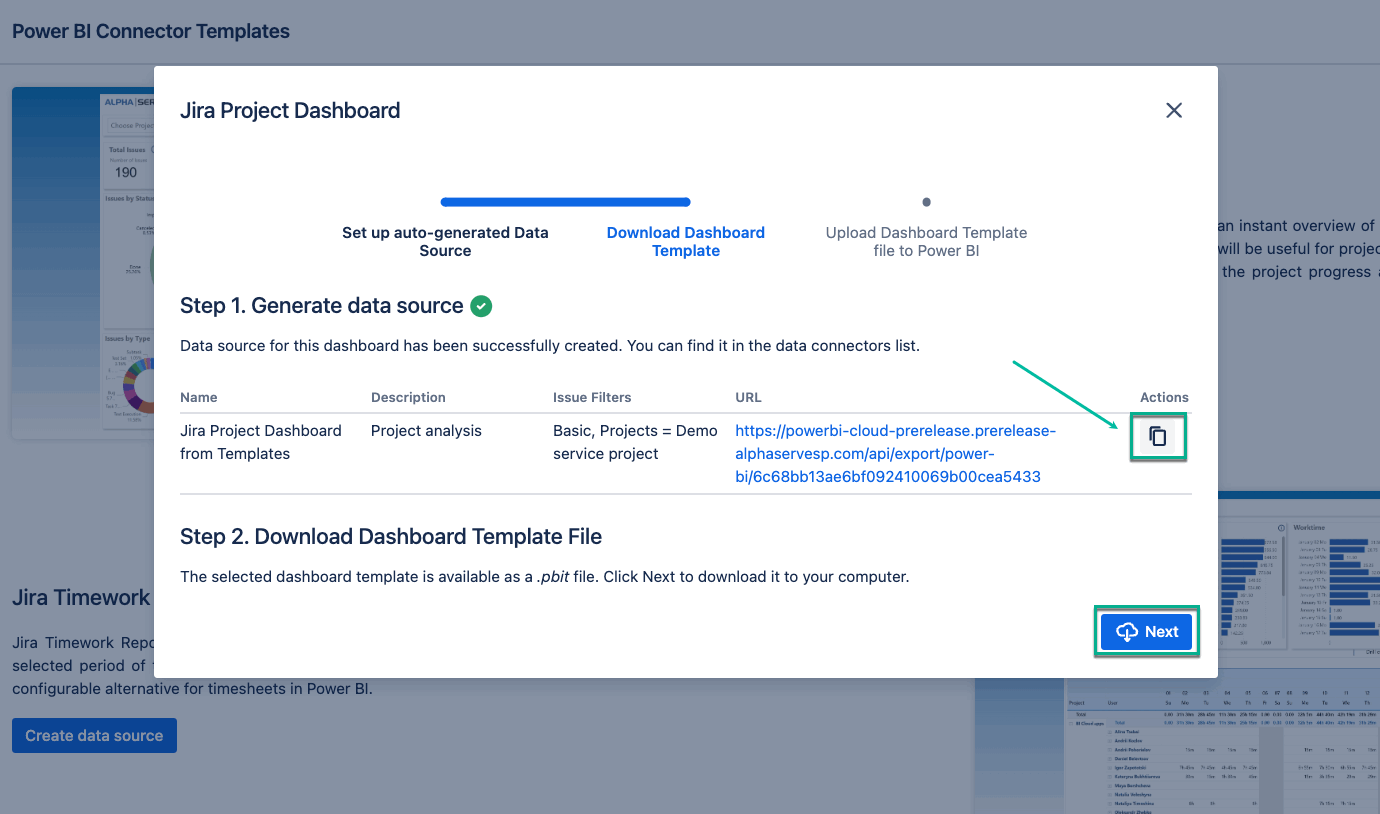
Copy the URL generated for the template and click Next again. It will download the dashboard template (.pbit file) to your computer.
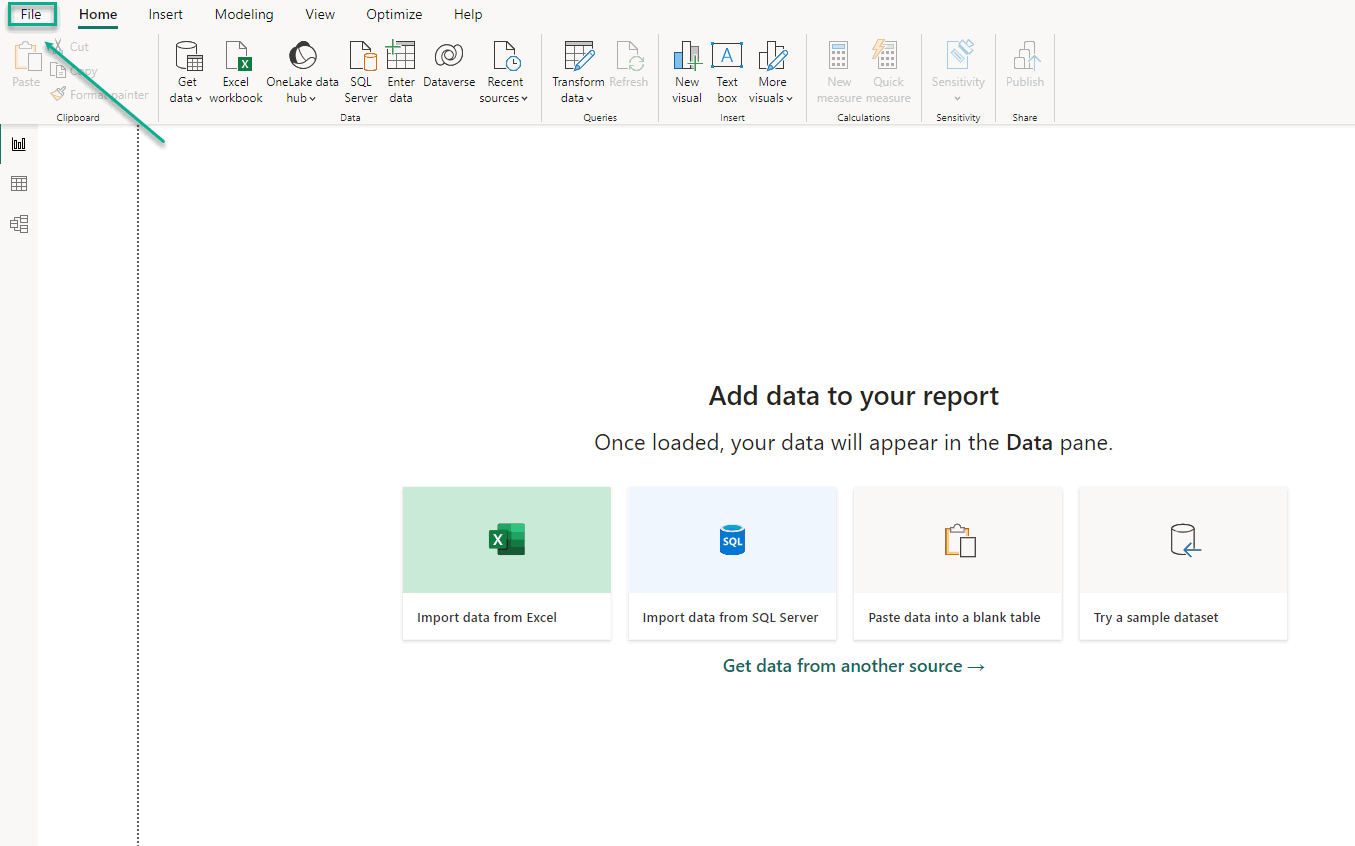
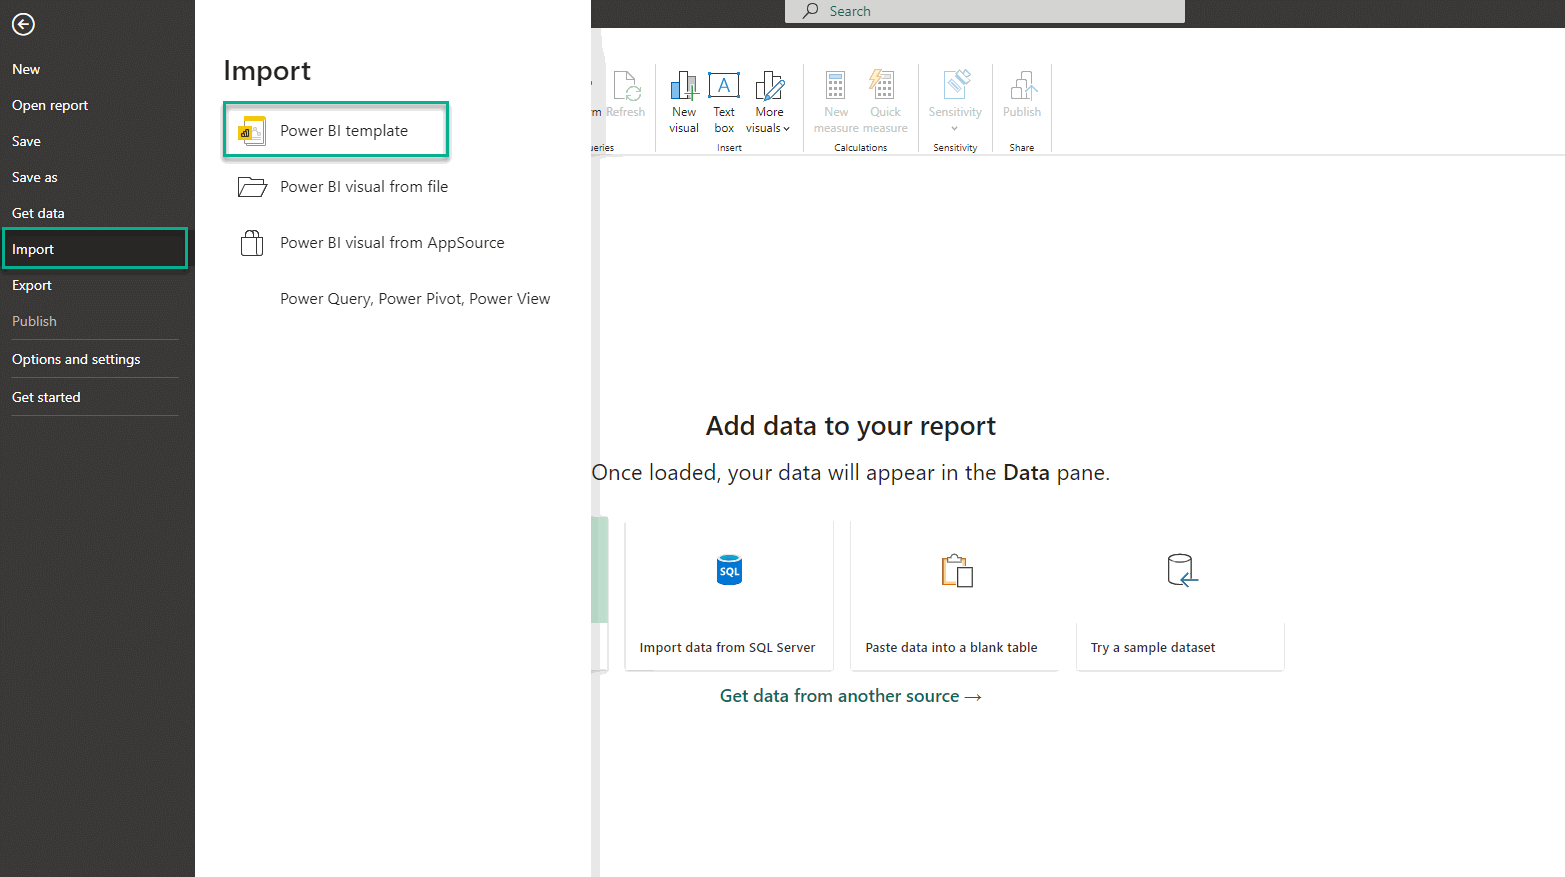
Open Microsoft Power BI, go to File, select Import, then Power BI template. Choose the .pbit file you downloaded.
Paste the copied URL into the Input_URL field and select Load. Select Basic authentication, enter your credentials, and click Connect.
Effective cost tracking is an important element in project management, as it enables managers to keep up-to-date with the financial situation of their projects. Tempo Cost Tracker Reports’ key metrics are vital for an organization’s financial health and project management effectiveness. The Jira Power BI integration allows to create a comprehensive Tempo Cost Tracker Report and provides valuable insights into cost management, resource allocation and overall project performance. The report aids in decision-making but also enhances financial transparency across projects.
Group projects into strategic reports to effectively measure and manage financial performance and enhance your project management with Tempo Cost Tracker.
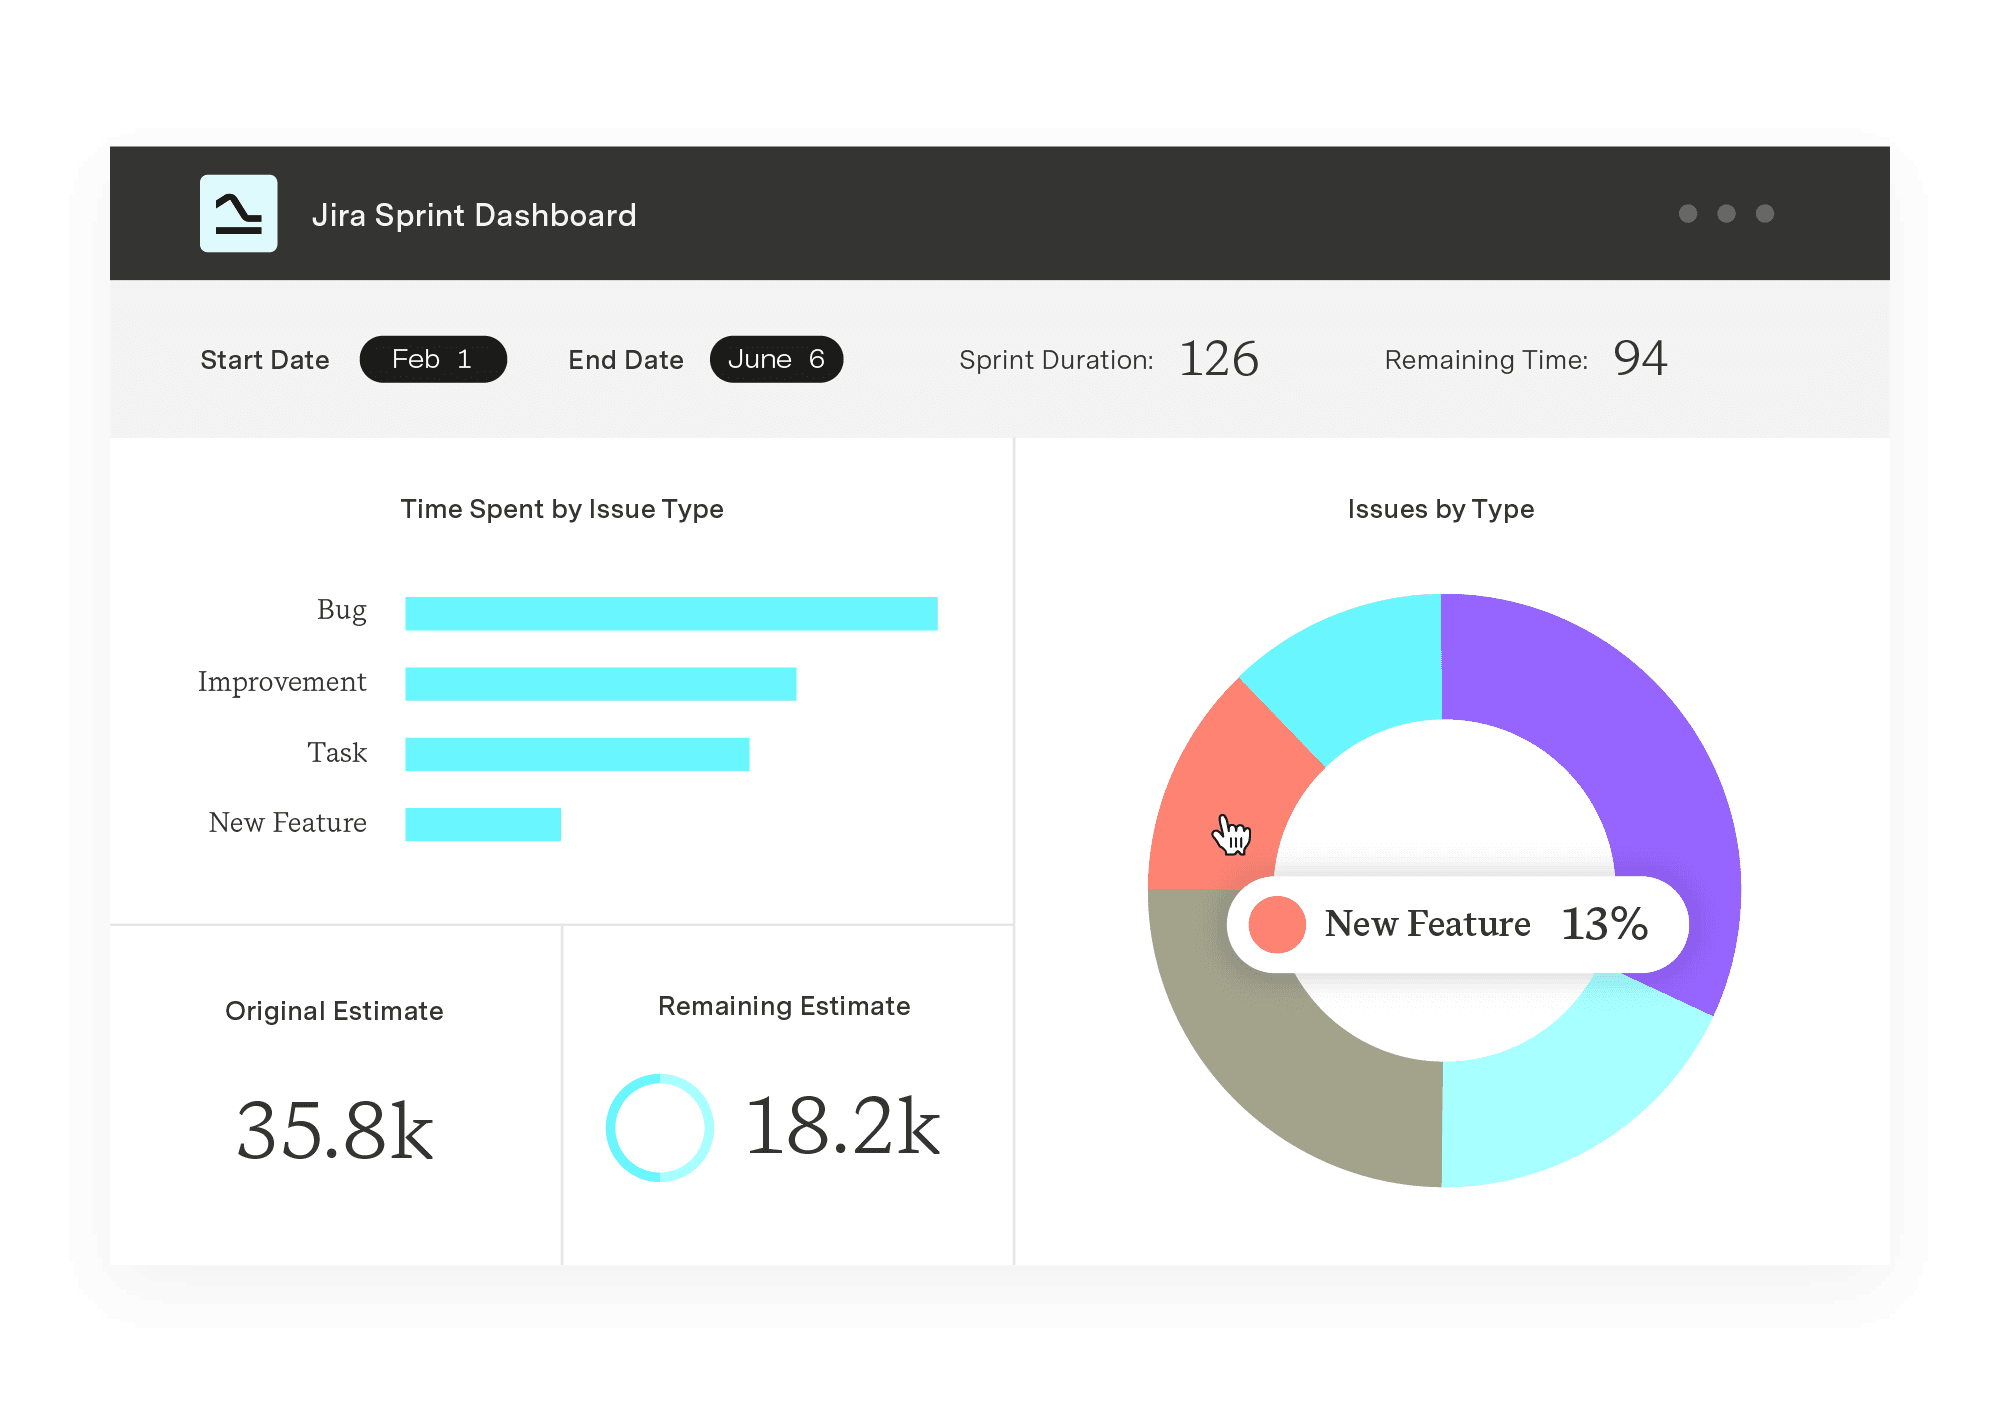
Power BI Connector for Jira
Experience a new standard in data integration and reporting. Enjoy quick setup, effortless data export from all Jira products and third-party apps, and instant access to pre-built templates.
Start a Free TrialEstablish alignment between stakeholders and team members with an essential source of informational truth. Learn to write an effective project brief.

You have a great idea. You’re ready to implement it. You need to get your boss’s approval. Here are 5 tips to getting to yes with your manager.

Why Intelligent Portfolio Orchestration (IPO) has become a category, why traditional SPM isn’t the answer, and why you should care.
Learn how to use a fishbone diagram for cause and effect analysis and discover how it can uncover problems in your organization.
Projects can stall for no reason. Read on to learn how to reengage in the project and finally finish it.

Building rapport means establishing trust and mutual respect at work. Learn how to create strong team & client relationships that drive collaboration.
Create a successful onboarding strategy with a 30-60-90 template. Learn how to plan, track, and achieve your goals in the first three months.

Build a workload management dashboard in Jira with Custom Charts. See assignee load, WIP, and time in status on one screen to rebalance work fast.

Celebrating team performance and individual success is important for building camaraderie and keeping everyone focused on achieving project success.