Statements of work are very common in project management, so you are going to come across many more in your career.

The Jira Software is used by teams of various sizes to manage projects and track issues seamlessly. The easy-to-use Jira dashboards offer a wide range of features that simplify the process of organizing, planning, and tracking all stages of an Agile development project. It also allows you to generate comprehensive reports that provide informative insights about your projects and issues. One such report is the Jira Sprint report, which provides insights into the progress of project sprints.
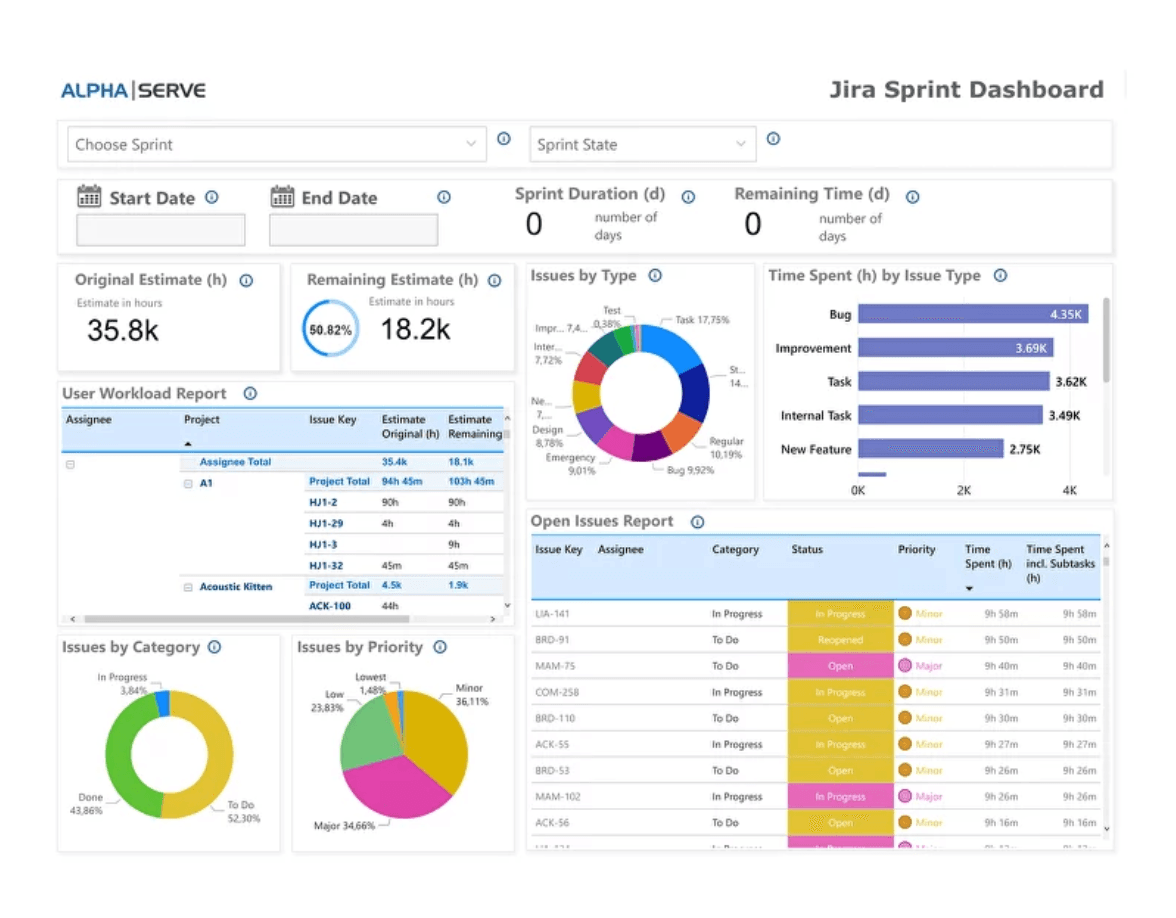
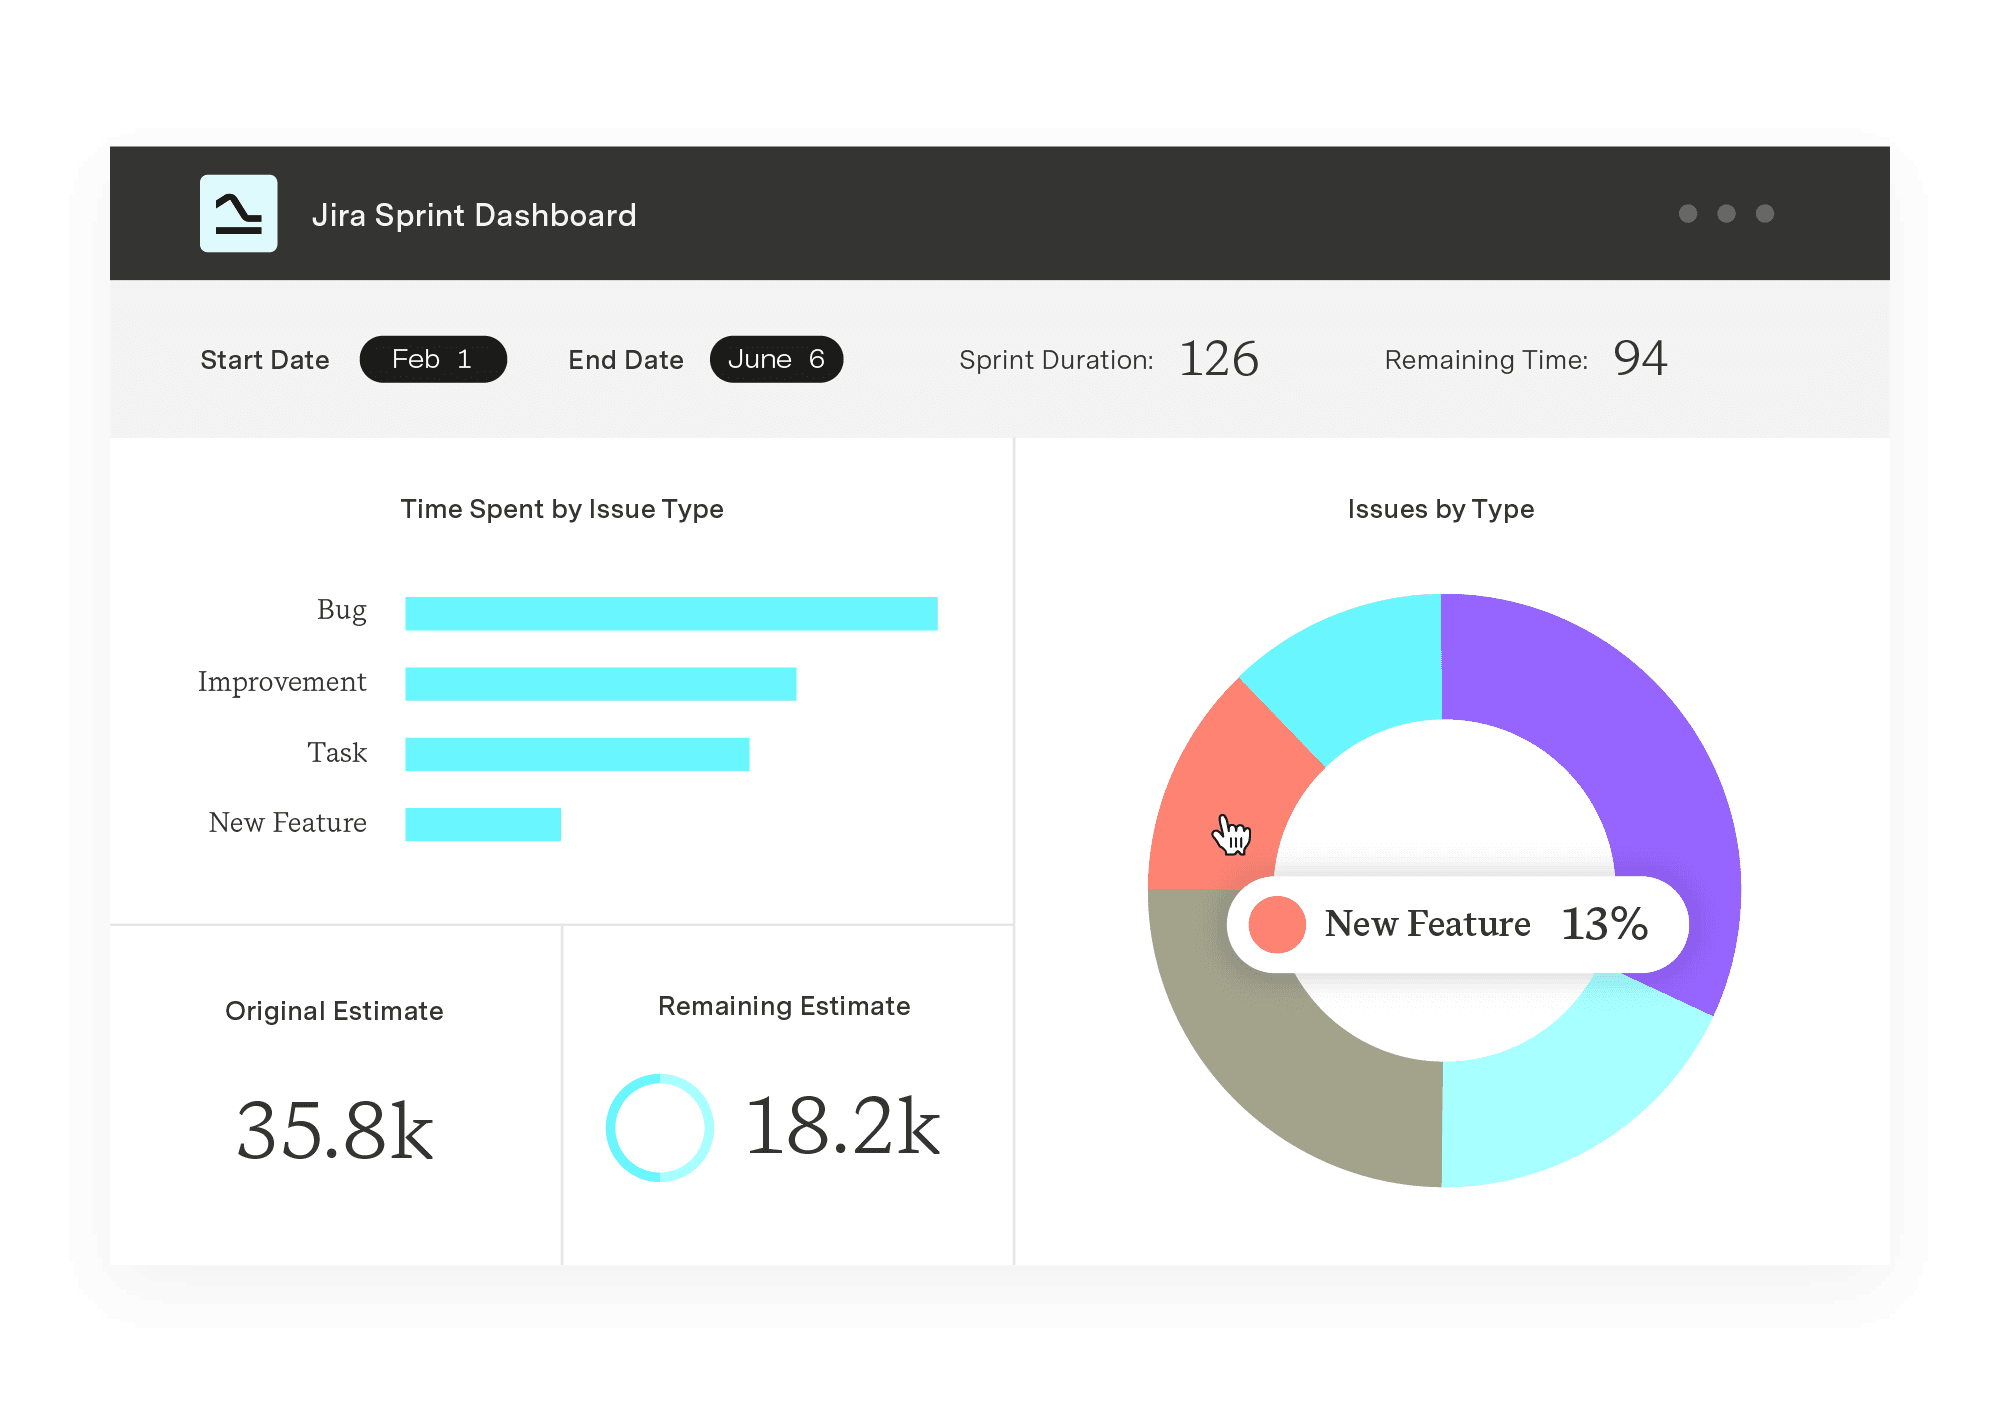
Although Jira has a default Sprint Report feature, you can maximize your sprint data better by visualizing it using a pre-built Sprint Dashboard template in Power BI. This post explains the reasons for creating Jira Sprint Dashboard in Power BI, the metrics and KPIs you can track with it, and how to create Jira Sprint Dashboard in Power BI.


The Jira Sprint Report is a key Jira report that provides valuable insights into how your sprint is doing. The report shows the list of issues in each sprint. This makes it useful for tracking the progress of your sprint, the burndown rate of work, and the overall performance of your project team.
Development teams having meetings to check the progress of their project or retrospective meetings to examine the performance of previously completed projects will find this report quite valuable. In addition to helping you to track where you are in the sprint, the report also helps you to identify the factors that may be hindering you from achieving everything you have committed to in a given sprint.
The sprint report in Jira is a great way to get a basic understanding of your sprint progress. You'll be able to see completed work or what's pushed back to the backlog and determine if your team is overcommitting or if there is excessive scope creep. However, it is a bit limited and superficial. Project teams can refer to it regularly, but you can get more information about your sprint progress by creating a custom Sprint Report in a BI tool like Power BI.

Although Jira’s built-in sprint reporting features and capabilities are quite robust, they don’t always fit the reporting needs that users have in mind. In addition to being superficial, default reports are typically limited to individual projects. This is inadequate especially when you’re working on multiple related projects and would like to combine data to track the progress of all of them.
Business intelligence tools like Power BI are designed to pick out data from Jira and other dynamic environments to generate deeper insights and simplify decision-making. Power BI allows you to generate consolidated reports across various business functions and processes.
Reporting is also easier with a BI tool. Instead of building individual charts in Jira, you can build one convenient dashboard in Power BI that helps to visualize and contextualize your data quite vividly. With all the features of Power BI, you can create any visual reports to suit your specific needs.
Microsoft Power BI also simplifies the process of sharing reports with stakeholders. You can share reports seamlessly with non-Jira users and the reports you share are automatically updated as new data is added.

The Jira Sprint Dashboard should include various metrics to track the progress of a sprint and/or metrics to measure the results of a completed sprint. This dashboard should give you a complete picture to help users analyze completed and ongoing sprints with just a glance at a single dashboard. Analyzing these metrics should help you to understand how your project is progressing, and possible interruptions, improvements, and changes.
Main Metrics and KPIs to include in your Sprint Dashboard:
Story points for issue estimation and to track the progress of work on a board
Number of hours spent
The actual work done
Unresolved issues
Issues that may have been added to or removed from the Sprint

To create Jira reports in Power BI, you have to integrate both platforms. The easiest way to do this is by doing a no-code Jira Power BI integration using a connector such as Alpha Serve’s Power BI Connector for Jira. This tool allows you to add Jira to Power BI as a data source and build custom reports seamlessly.
With the Power BI Connector for Jira, you can start creating interactive dashboards that provide insights into your Jira data. The connector also offers pre-built dashboard templates which you can use to instantly build Jira reports in Power BI. The Sprint Dashboard template is one of the templates available in Power BI Connector for Jira with pre-configured data sources. To create your first Jira reporting dashboard with a ready-made template you need to install the connector, download the template file, and upload it to Power BI to generate your report.
Here is a short step-by-step instruction on how to get the Power BI Connector for Jira and how to create Jira Sprint Report with it.
Step 1. Install Power BI Connector for Jira
Note! You must have Jira Administrator rights to be able to install the app. You can install Power BI Connector for Jira app from the Apps section in your Jira Cloud account or directly from the Atlassian Marketplace product page. From Jira Cloud Apps, navigate to the Explore more apps section and type “Power BI Connector for Jira Alpha Serve” in the search box. Select Power BI Connector for Jira from the search results.
Click Try it free. In the opened window click on Start free trial. The download and installation will commence and you will be notified once the plugin has been installed. Once installed, you can easily find the connector from the main navigation menu: Apps → Power BI Connector for Jira.
Read this installation guide to learn about the installation process.
Step 2. Download the Jira Sprint Dashboard Template File
The Power BI Connector for Jira has pre-built dashboard templates that make it easy to create Power BI reports as Jira Sprint report in just a few clicks.
You can find these features in the “Templates” section of the connector.
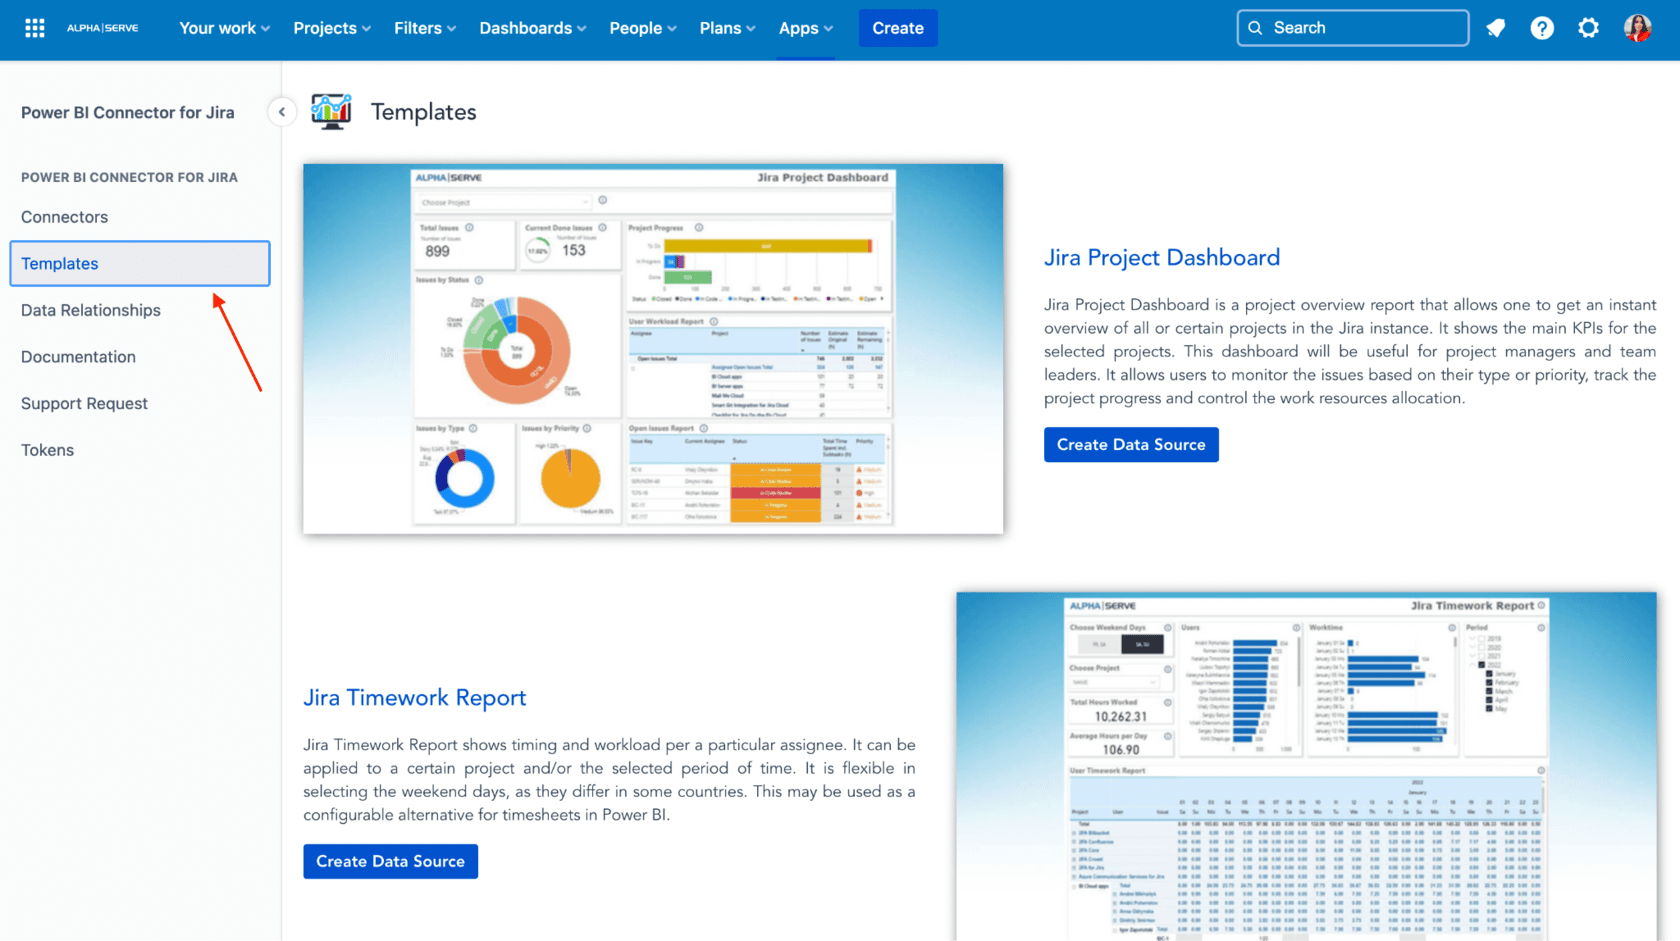
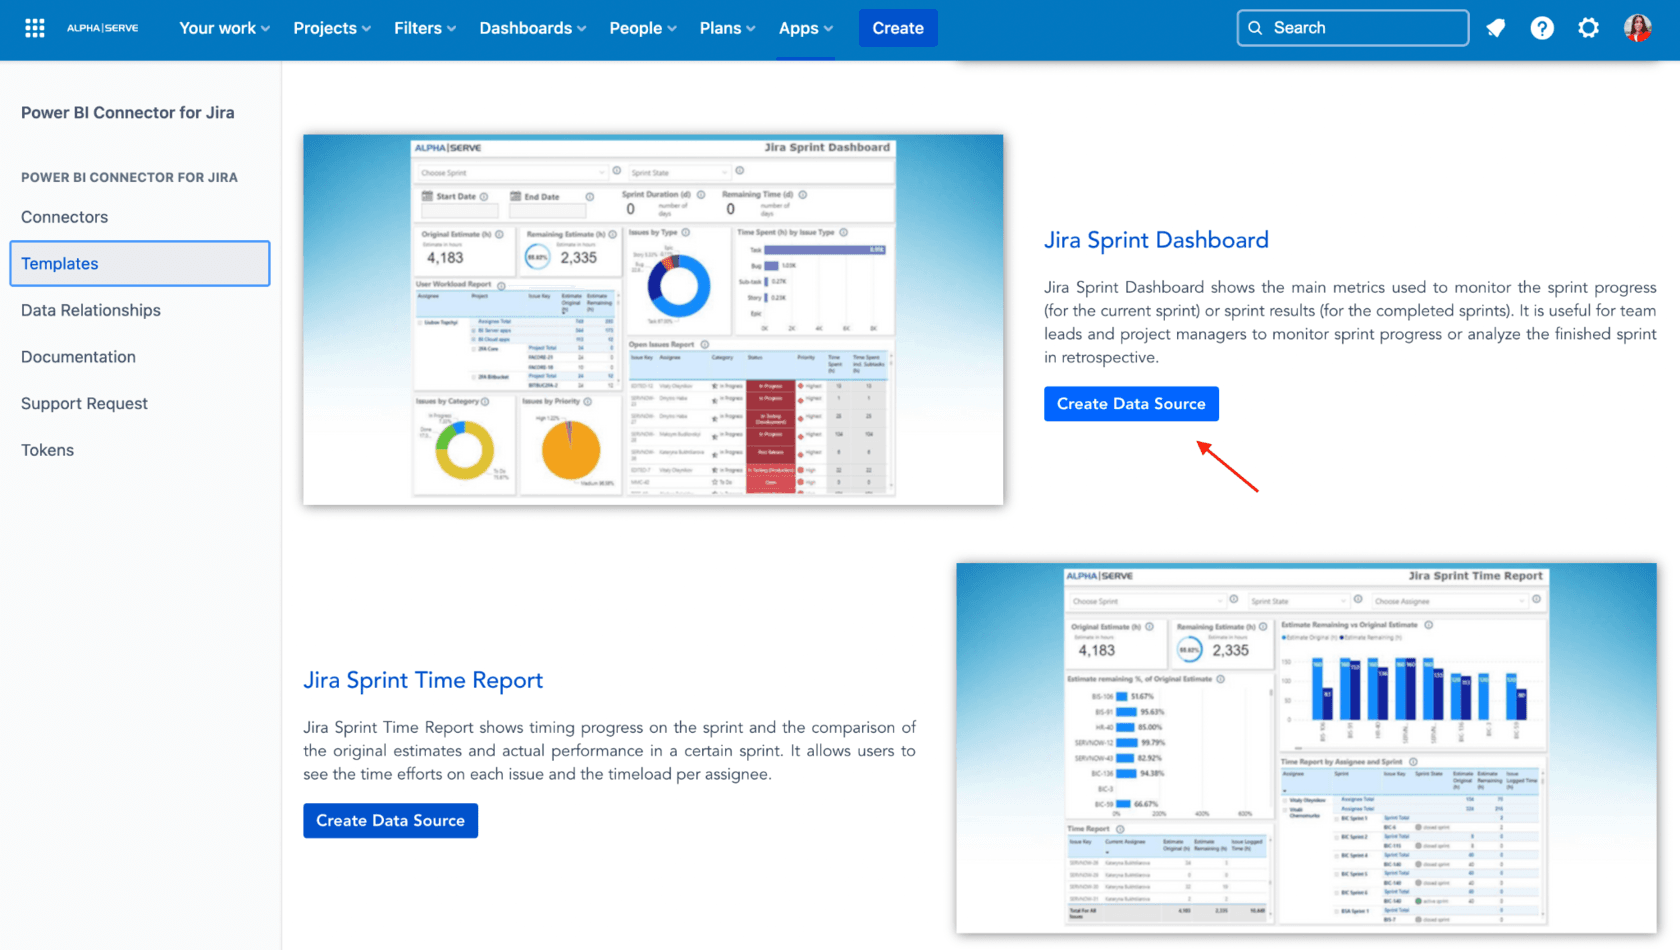
In this section, select any of the available dashboard templates (in our case, you need the Jira Sprint Dashboard template).
Select the template and click on Create Data Source button.
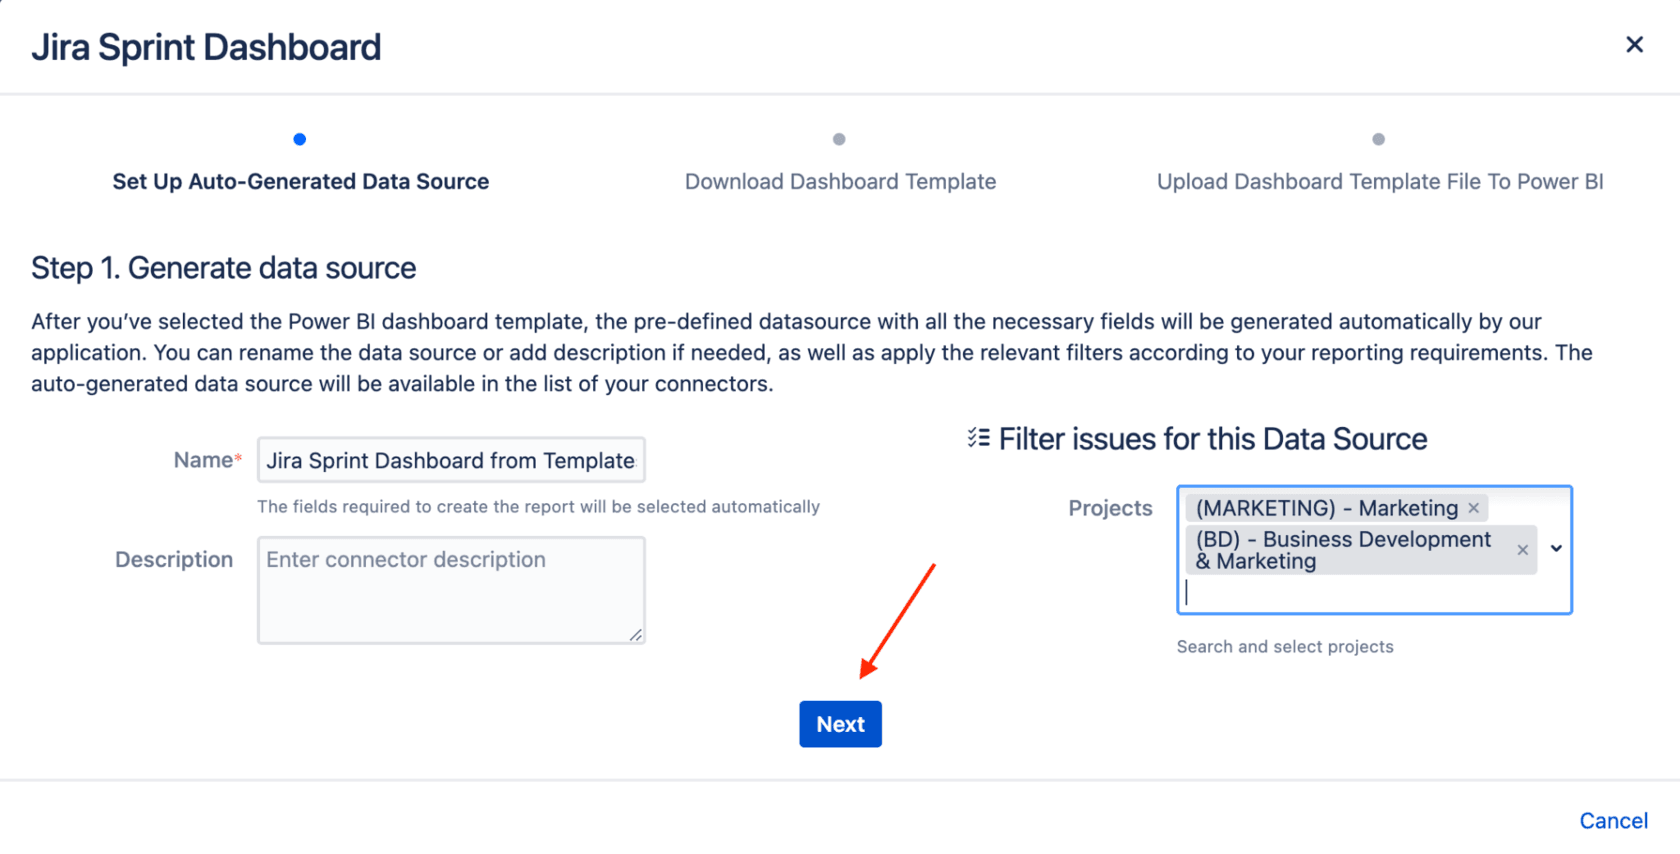
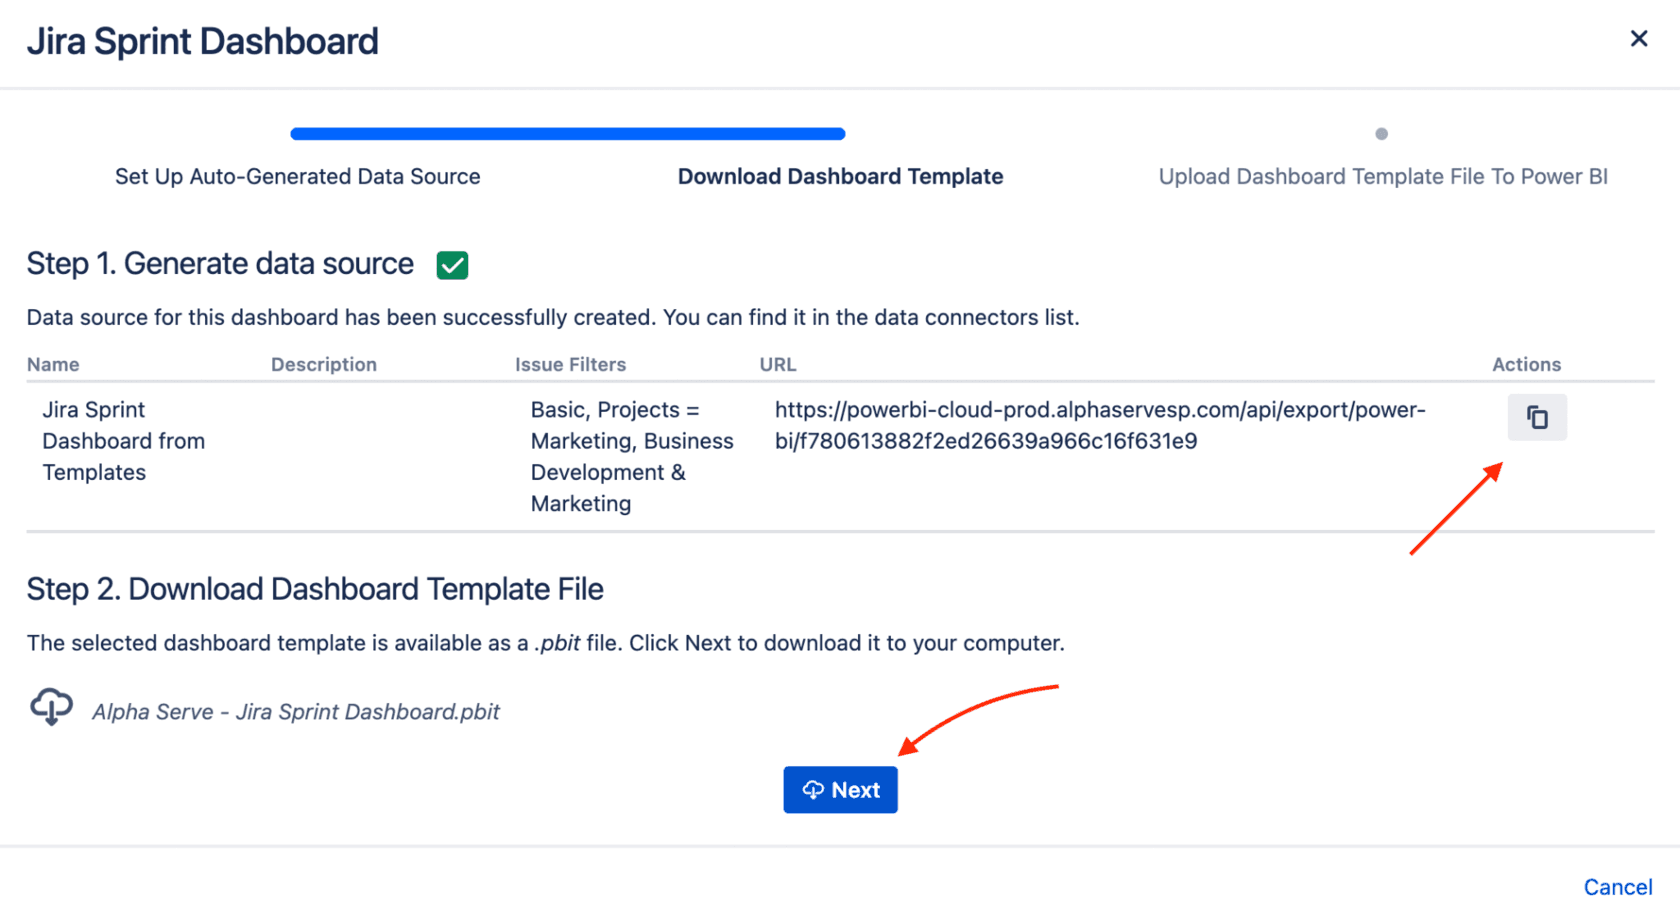
Set up the data source. You can set the data source name, add a description and apply a project filter. Click Next.
Copy the data source link and click Next button to download the .pbit file.
Step 3. Upload Jira Sprint Dashboard Template File to Power BI
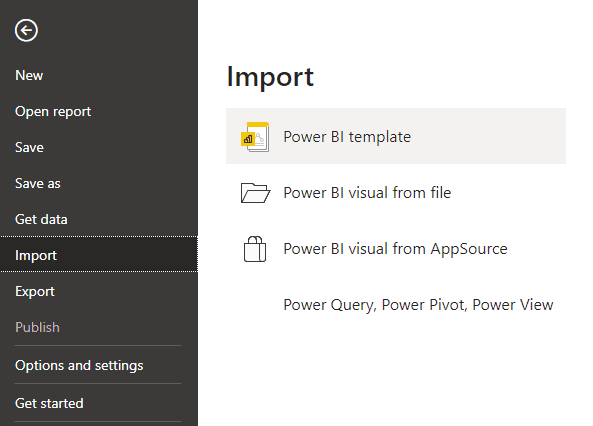
The final step is to upload the template file you have downloaded. To do this, open Power BI Desktop. Import the downloaded template file by going to File > Import > Power BI template.
In the next window, insert the data source URL you copied before. Click Load. Select Basic Authentication and input your credentials.
That's it! Now you have your Jira Sprint Dashboard in Power BI.
For more information about Power BI Connector for Jira dashboard templates check our documentation.
When working on a project organized into sprints, it is important to always have a clear picture of the status of the project and track progress. By generating a Jira dashboard sprint report, you’re more likely to get a comprehensive understanding of your project’s performance and the steps you need to take to execute it.
Although Jira’s default sprint report feature works great for this purpose, you’ll enjoy even more meaningful insights delivered in an easily-digestible way when you make use of Power BI. Thankfully, the Power BI connector for Jira makes it possible to generate this report from an easy-to-use template.
Power BI Connector for Jira
Experience a new standard in data integration and reporting. Enjoy quick setup, effortless data export from all Jira products and third-party apps, and instant access to pre-built templates.
Start a Free TrialStatements of work are very common in project management, so you are going to come across many more in your career.

Vague goals and poorly defined requirements won’t hold you back once you incorporate rolling wave planning into your project management toolkit.

Compare the best capacity planning software for engineering teams on Jira. See how six tools handle two-way sync, utilization, and plan vs. actual.
Discover how to use a competitive analysis template to assess market rivals, compare strategies, and align your stakeholders toward a common goal.
Knowing which Agile at Scale metrics will best track your team’s productivity and success helps you set realistic KPIs and improve performance.

Stretch goals are just outside your reach, but that doesn’t mean they’re unachievable. These are ambitious goals that push you and your team further.

As a project manager, it's important to know when to delegate work. Check out these questions and their answers to become an effective delegator.
See how Structure PPM brings overdue task tracking into Jira with real-time reporting, dashboards, and portfolio rollups built for delivery teams.
Interpersonal skills at work decide whether hybrid teams ship. Here's what to practice, and why "soft skills" undersells how hard they are.