Use a business requirements document template to align teams, clarify goals, and streamline project planning for successful execution.

We're excited to announce that we have released a significant new feature to our top-rated Power BI Connector for Jira app.
Power BI dashboard templates supported with pre-configured data sources are now available in the latest version of Power BI Connector for Jira. We've been working hard on this feature for the past 12 months and are happy to share all details about the release in this article.

The Alpha Serve team has constantly been receiving requests from Power BI Connector for Jira customers to assist in building dashboards in Power BI. With a focus on developing feedback-driven applications, we decided to release the Power BI templates feature to meet customers' demands on the one hand, and allow users who are trialing the application to see Power BI dashboard examples that they can build using our Power BI Connector for Jira.
Now with built-in Power BI dashboard templates, you can create Jira reports in Power BI in just 3 easy steps. Simply select any of the available Power BI dashboard templates, download a file, and get your Jira data visualized.
The data sources for each available Power BI report template are pre-configured. Each data source already contains all the fields required to build a Jira report with the corresponding template. Thus, Power BI Connector for Jira offers the most automated process of creating Jira reports with dashboard templates, eliminating the need for users to select the tables and fields required for reports on their own.
After conducting a comprehensive analysis of both the direct Power BI Connector for Jira users' requests and the need for custom reporting in Jira, in general, we approved and implemented the 8 core Power BI dashboard templates. Now let's dive in and take a look at the full list of available templates with a brief description of each.
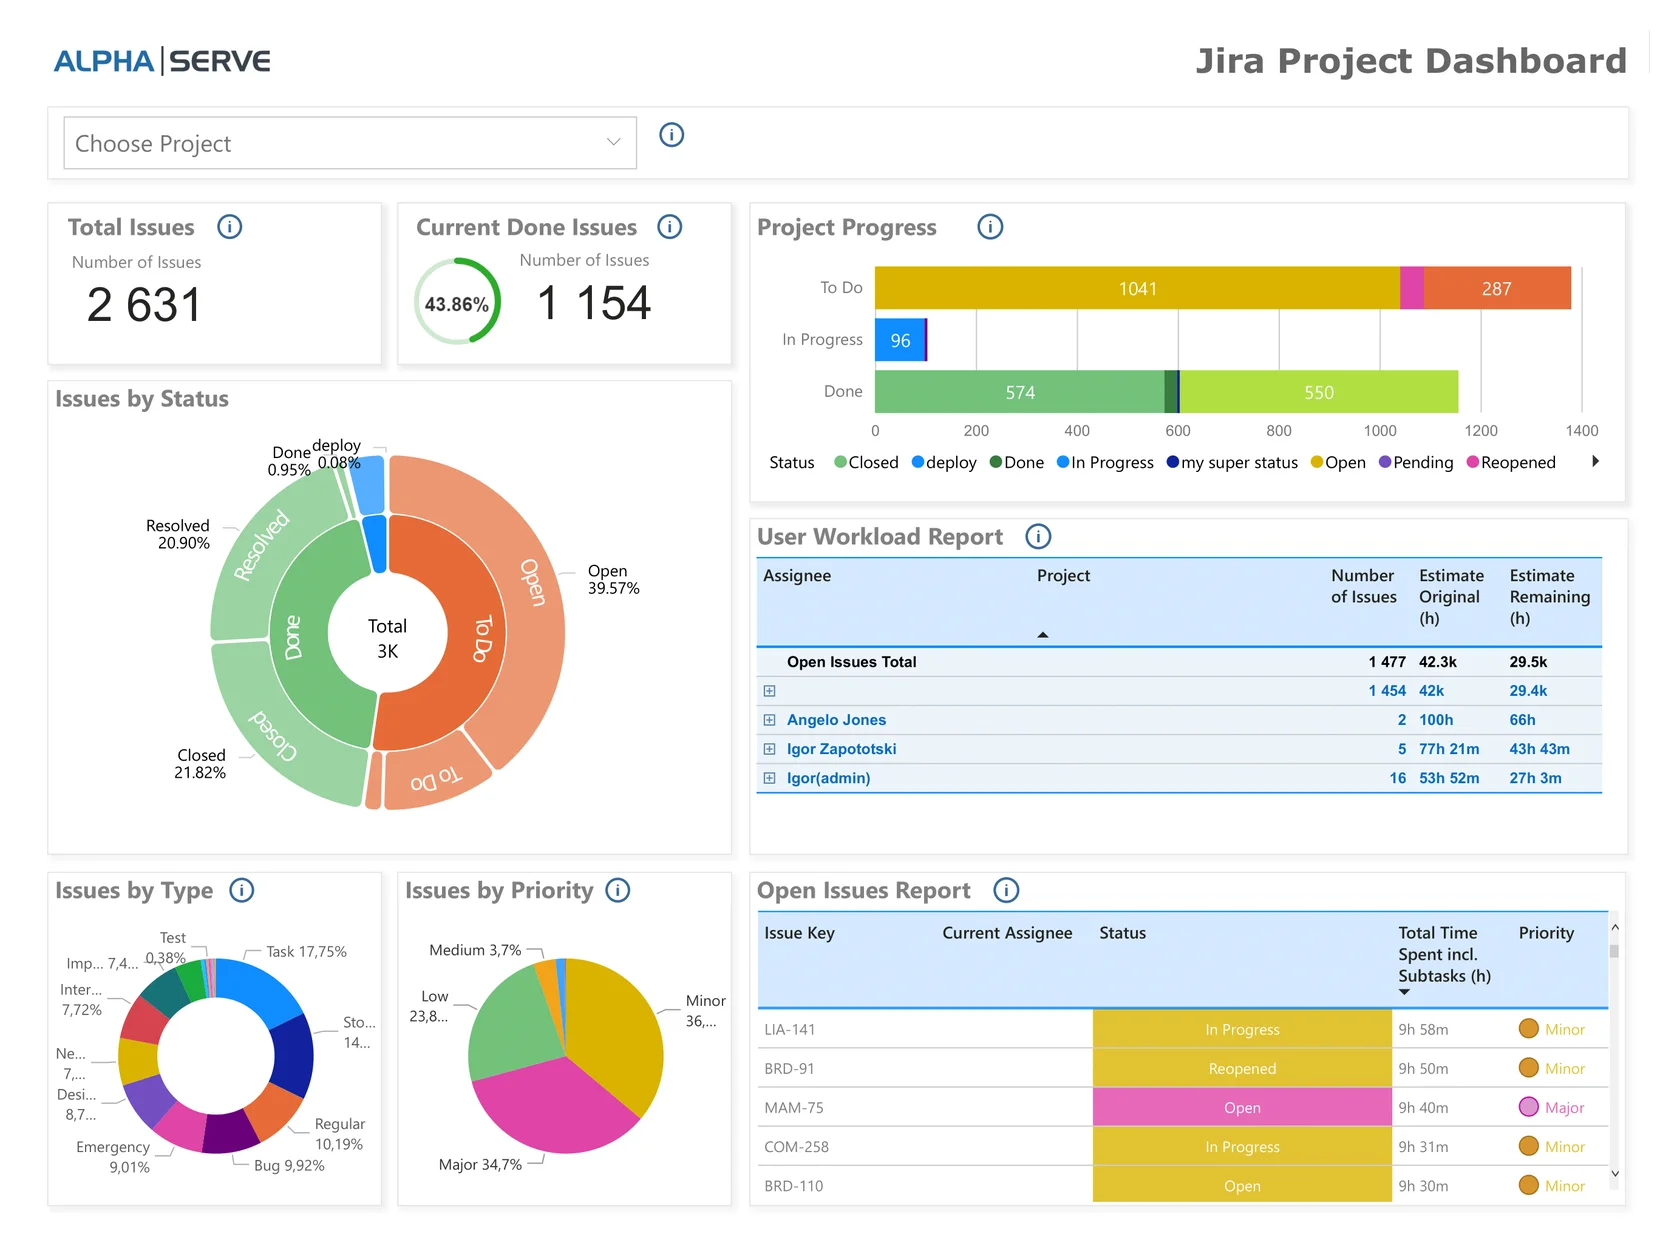
Jira Project Dashboard - this is a project overview report that shows the main KPIs for the selected projects. You can get an instant overview of all projects in the Jira instance or just the ones you need.
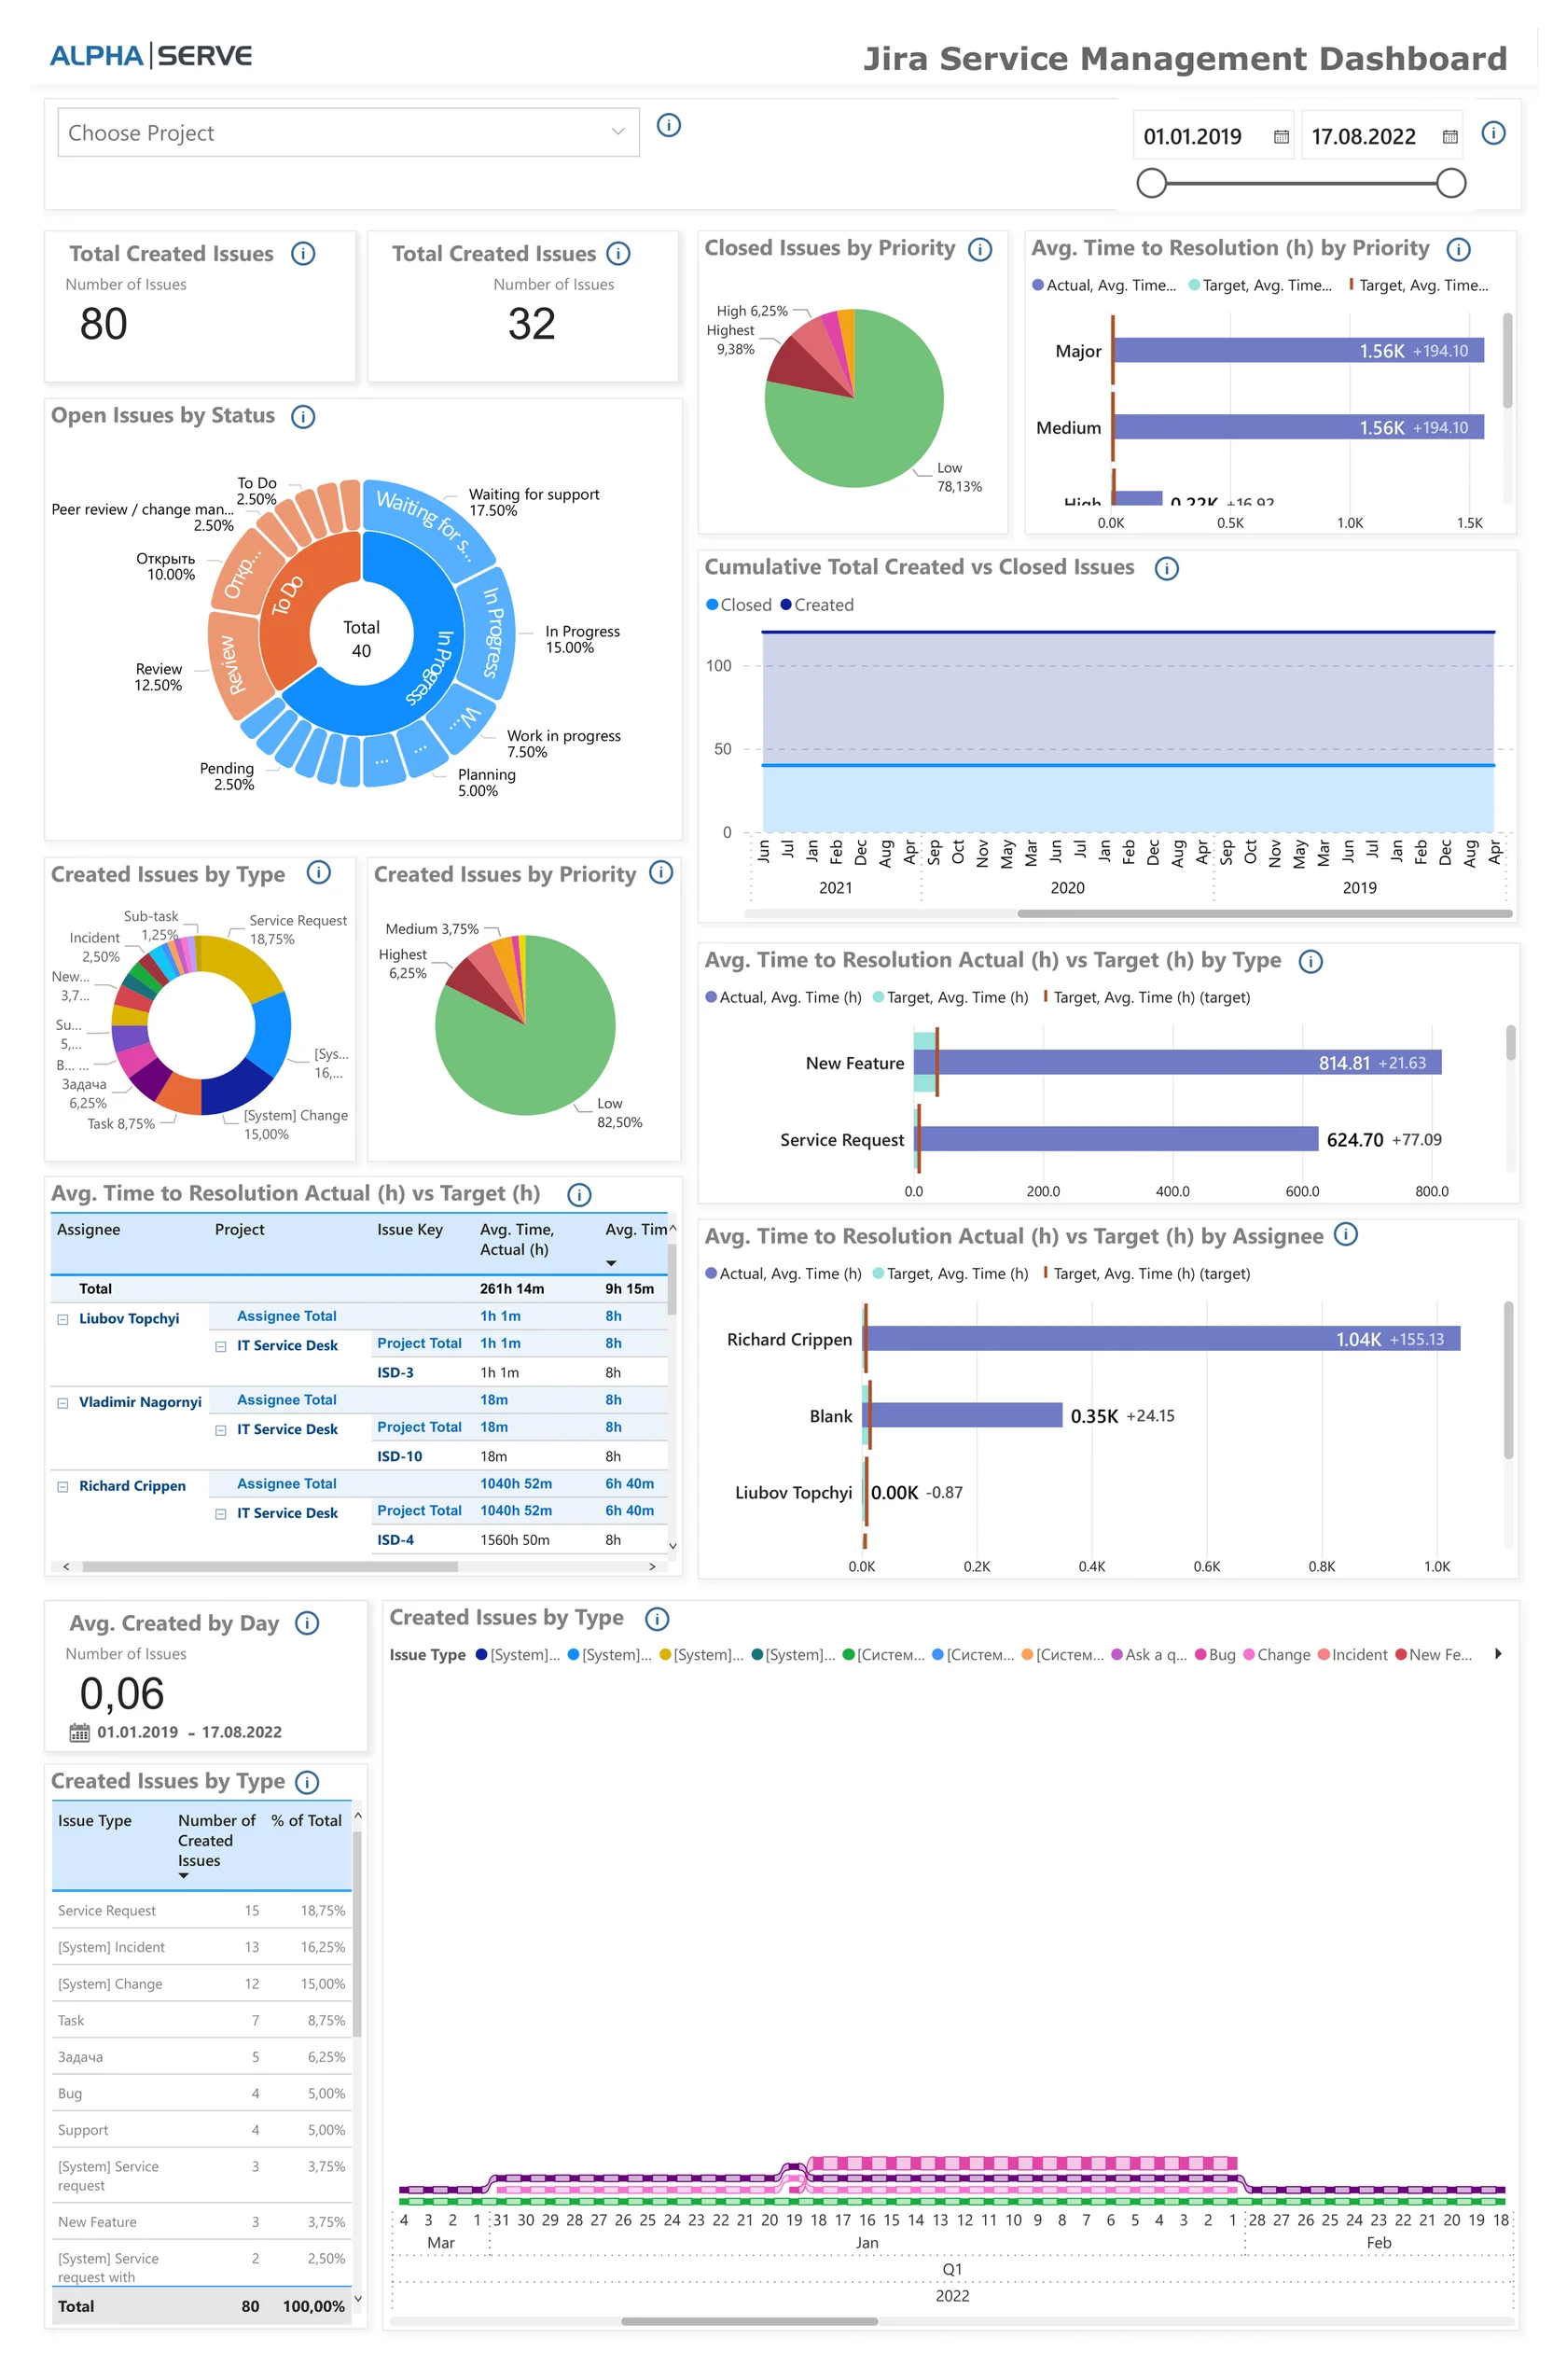
Jira Service Management Dashboard displays information about JSM projects and team performance as well as the key service level indicators for the definite Jira ITSM projects.
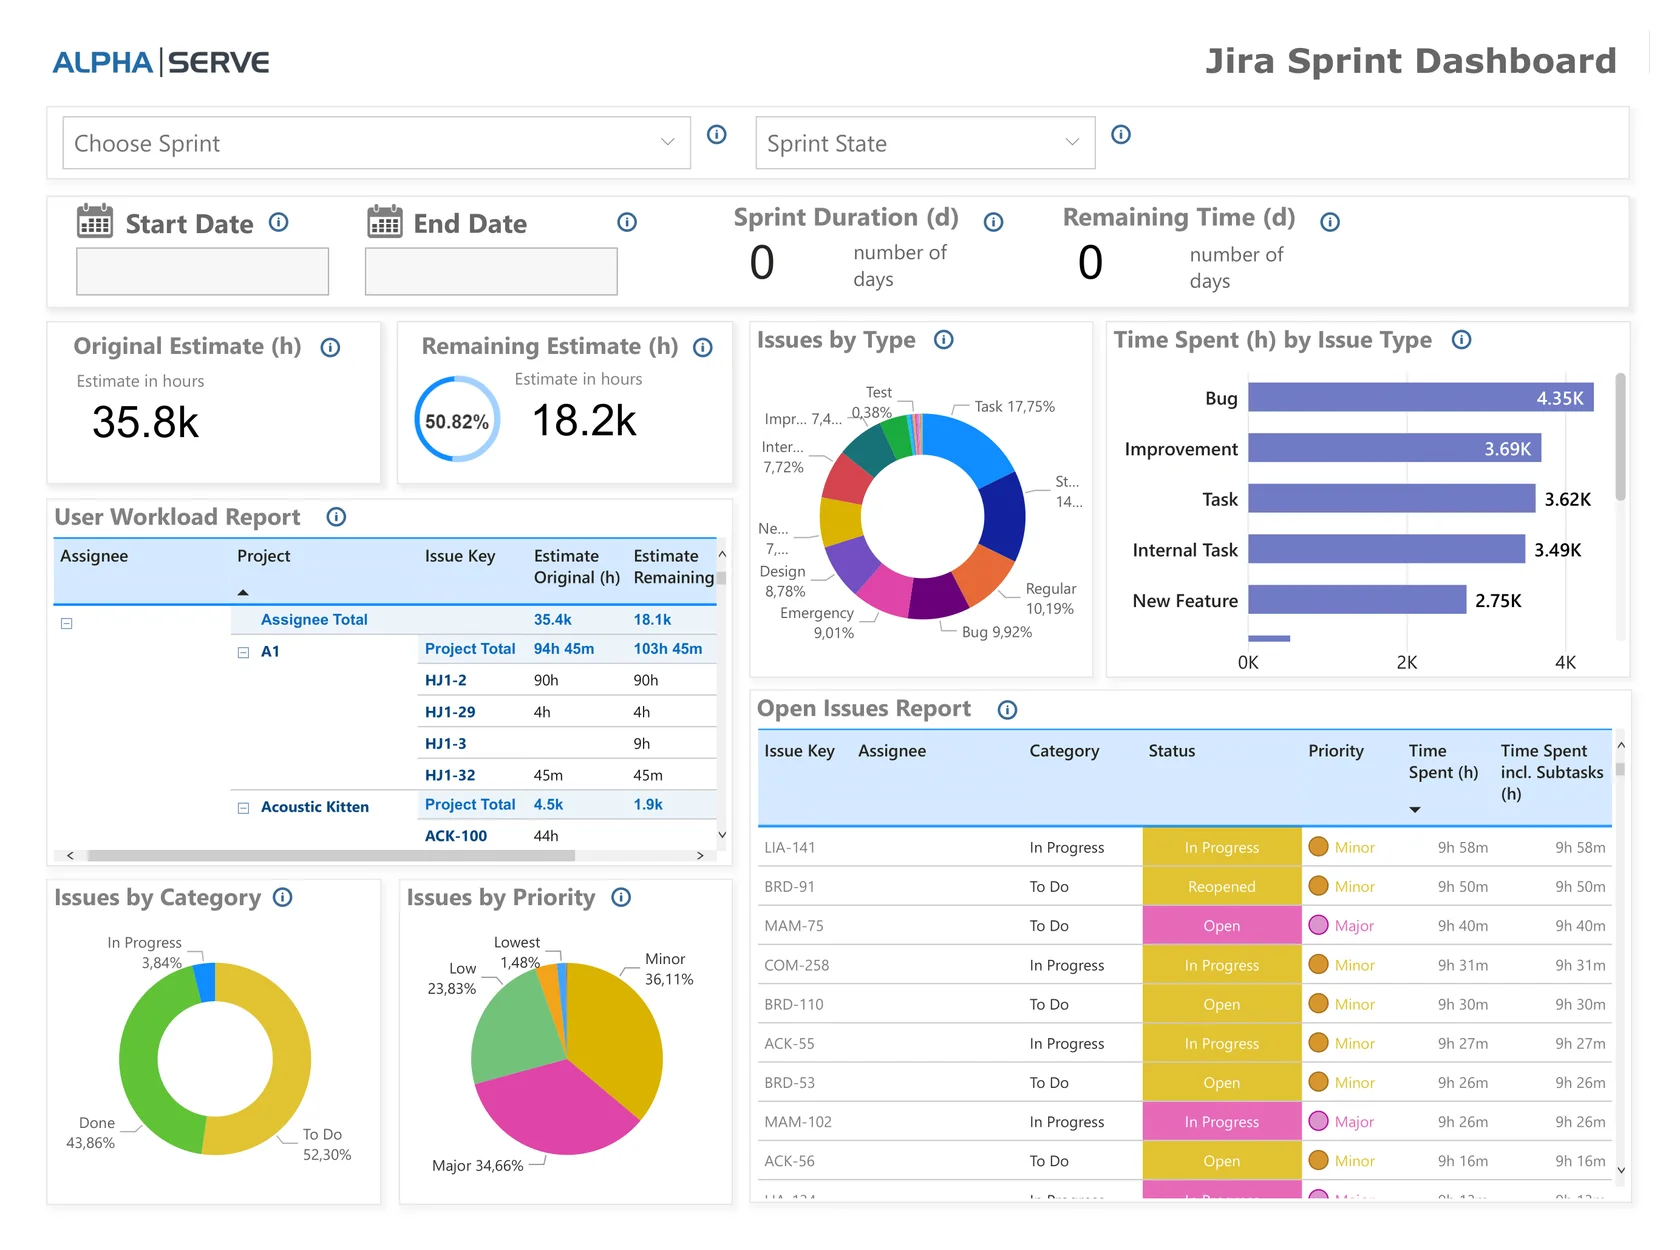
Jira Sprint Dashboard displays key metrics to track the progress of an active sprint or the results of a completed sprint.
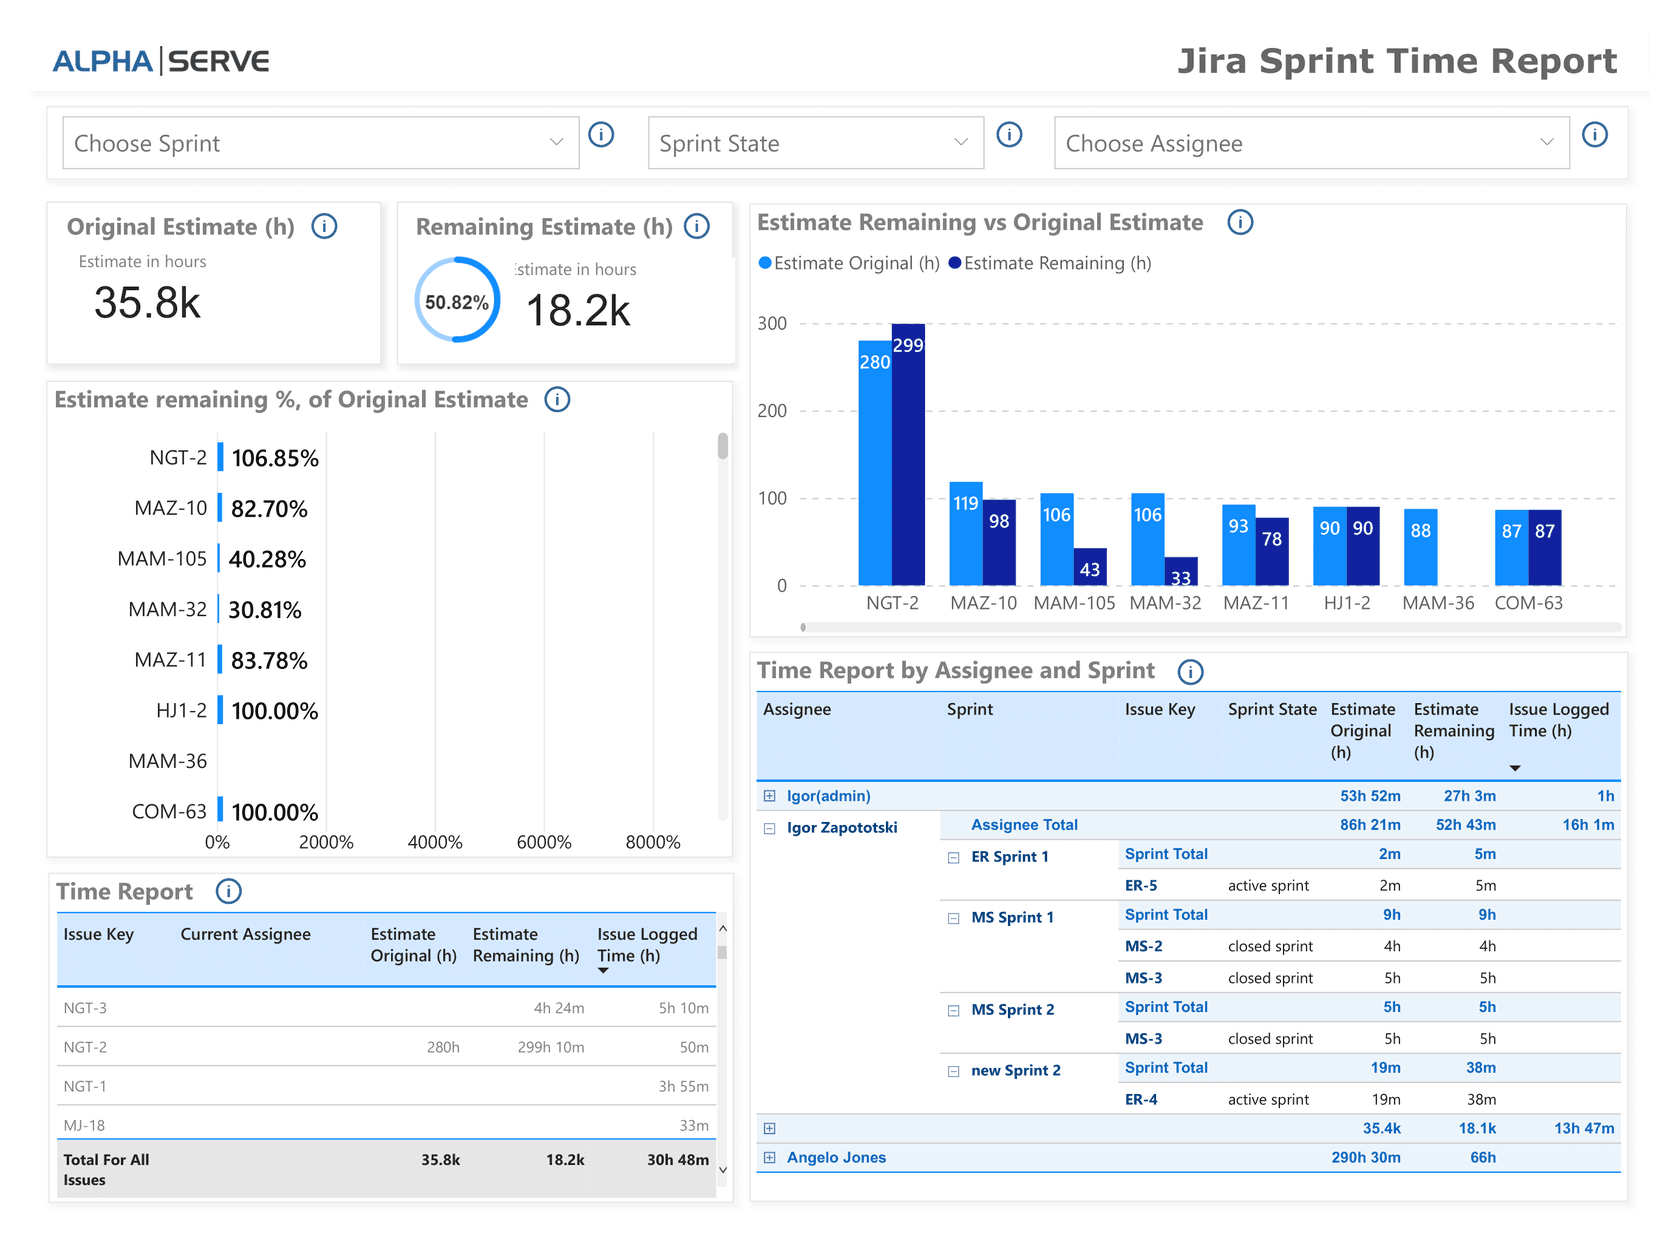
Jira Sprint Time Report visualizes timing progress on the sprint as well as the comparison of the original estimates and actual performance in a particular sprint.
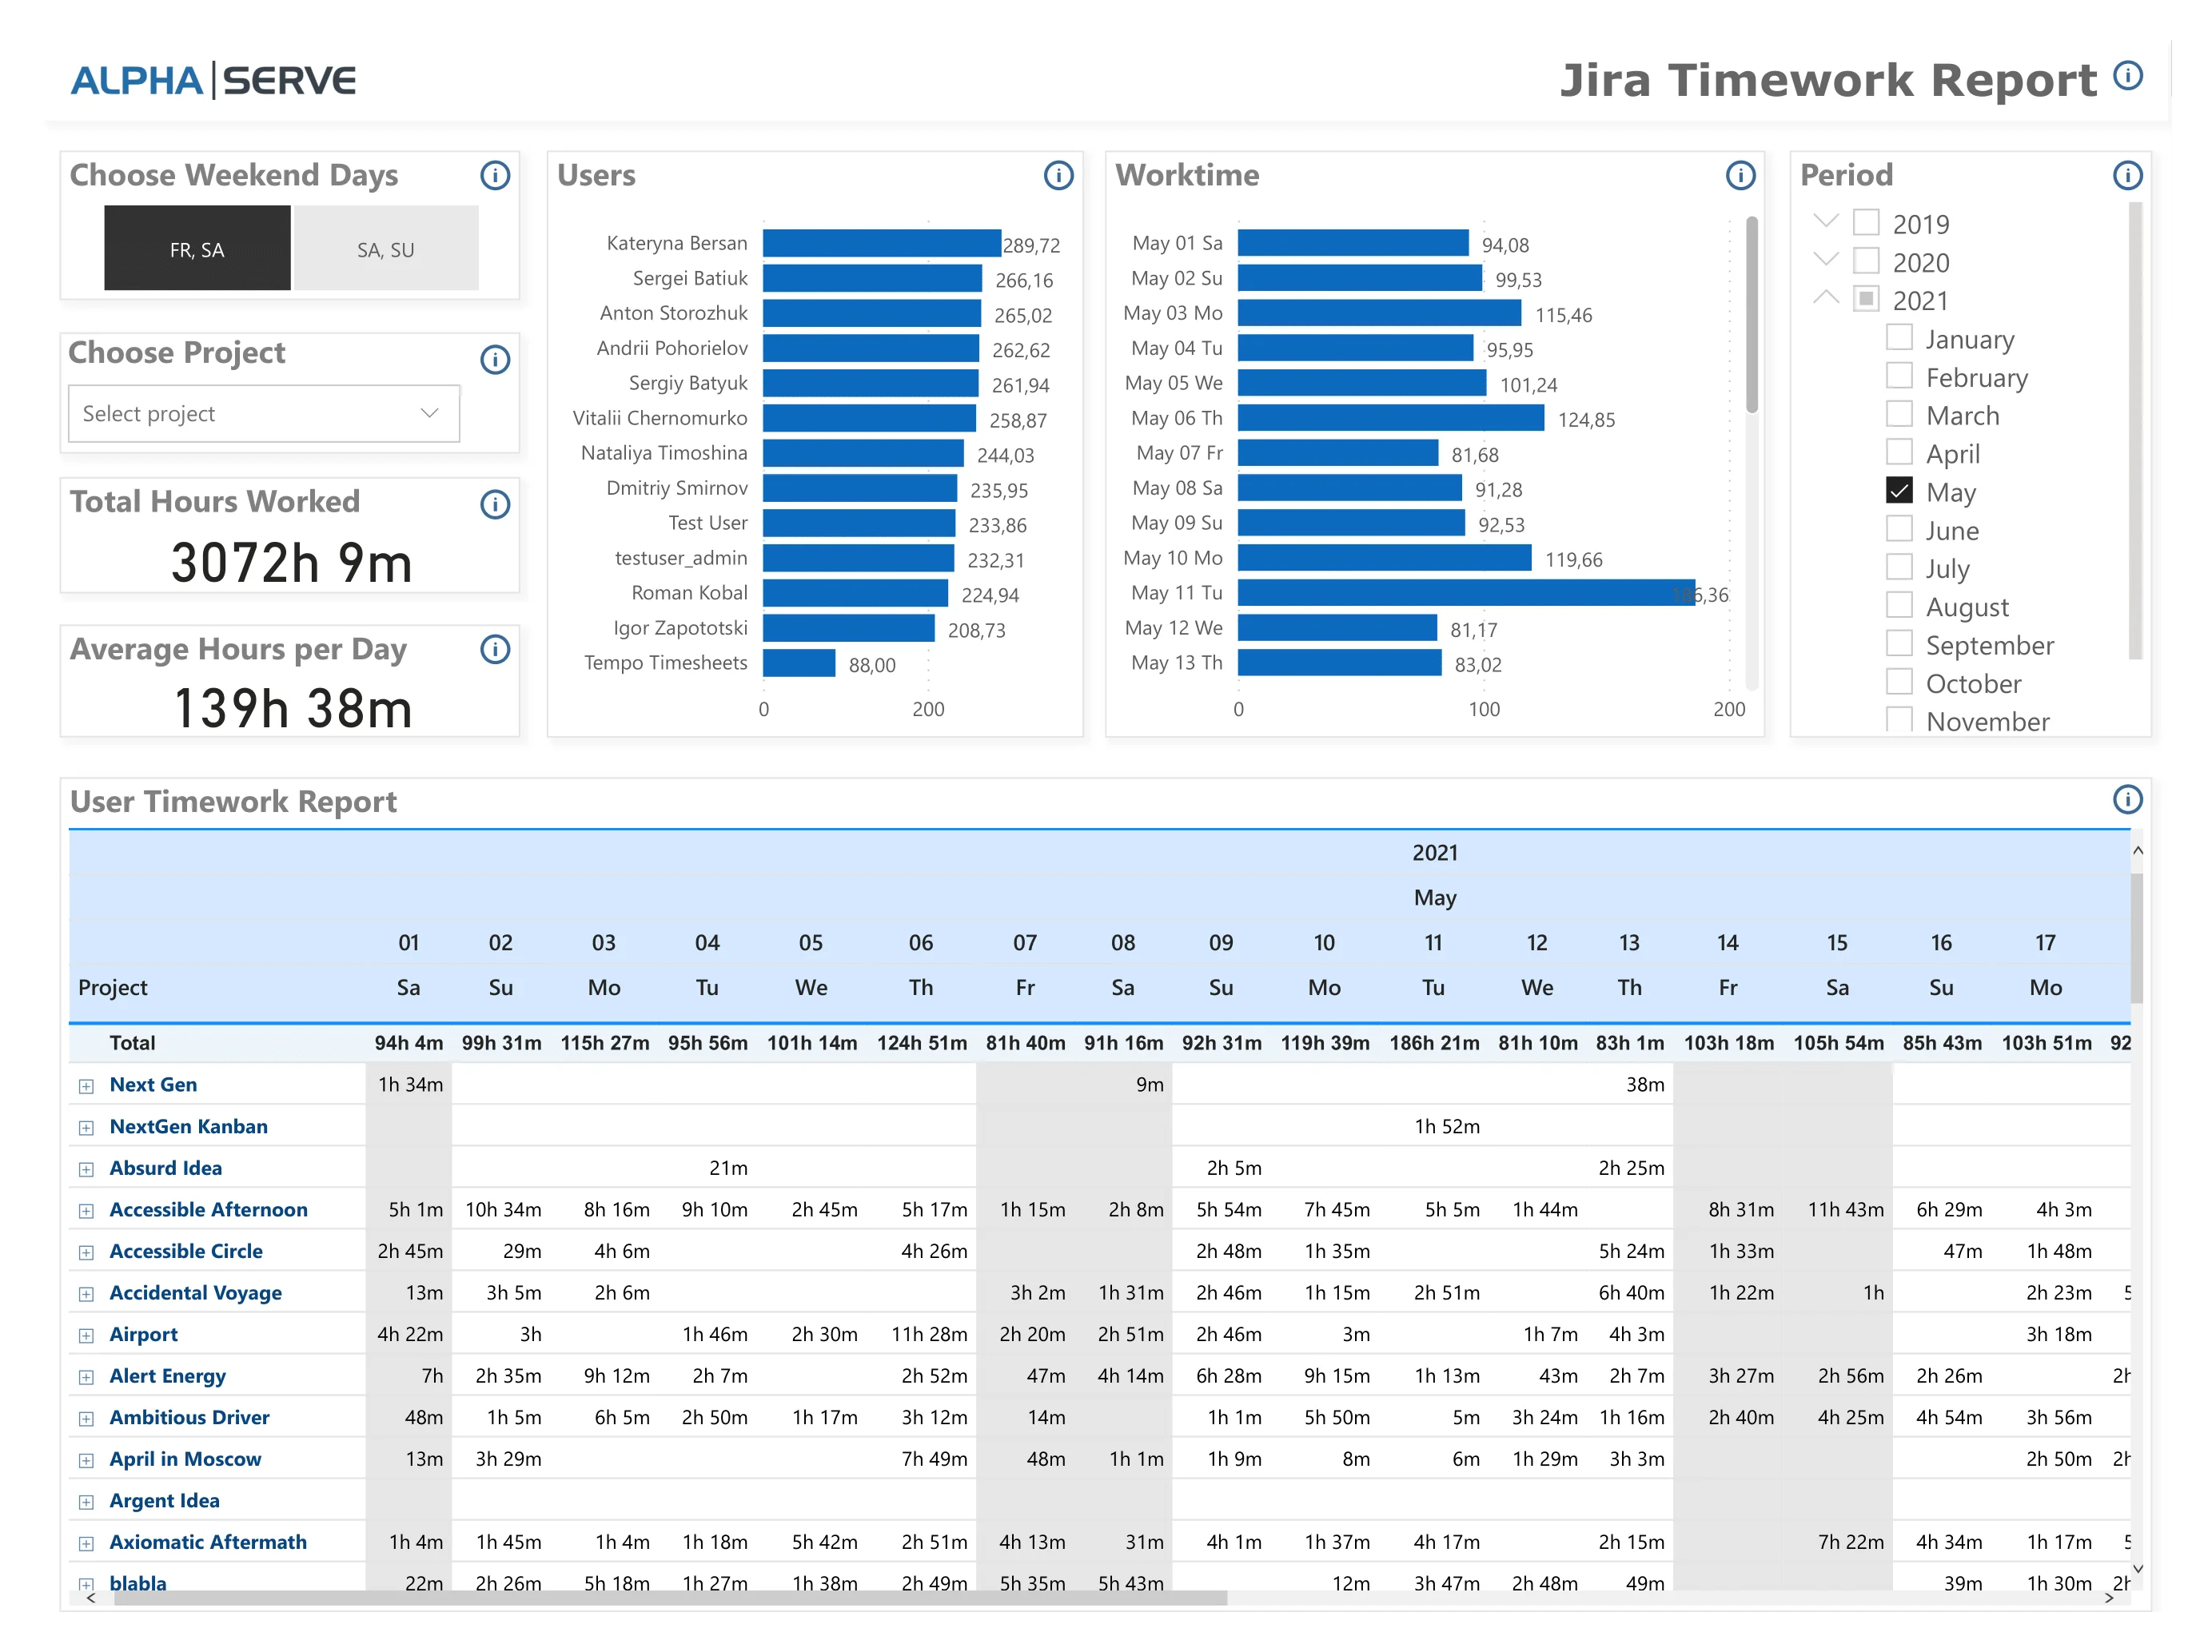
Jira Time Work Report is a complete Jira work log report that shows timing and workload per a particular assignee and can be applied to a specific project and/or the selected time period.
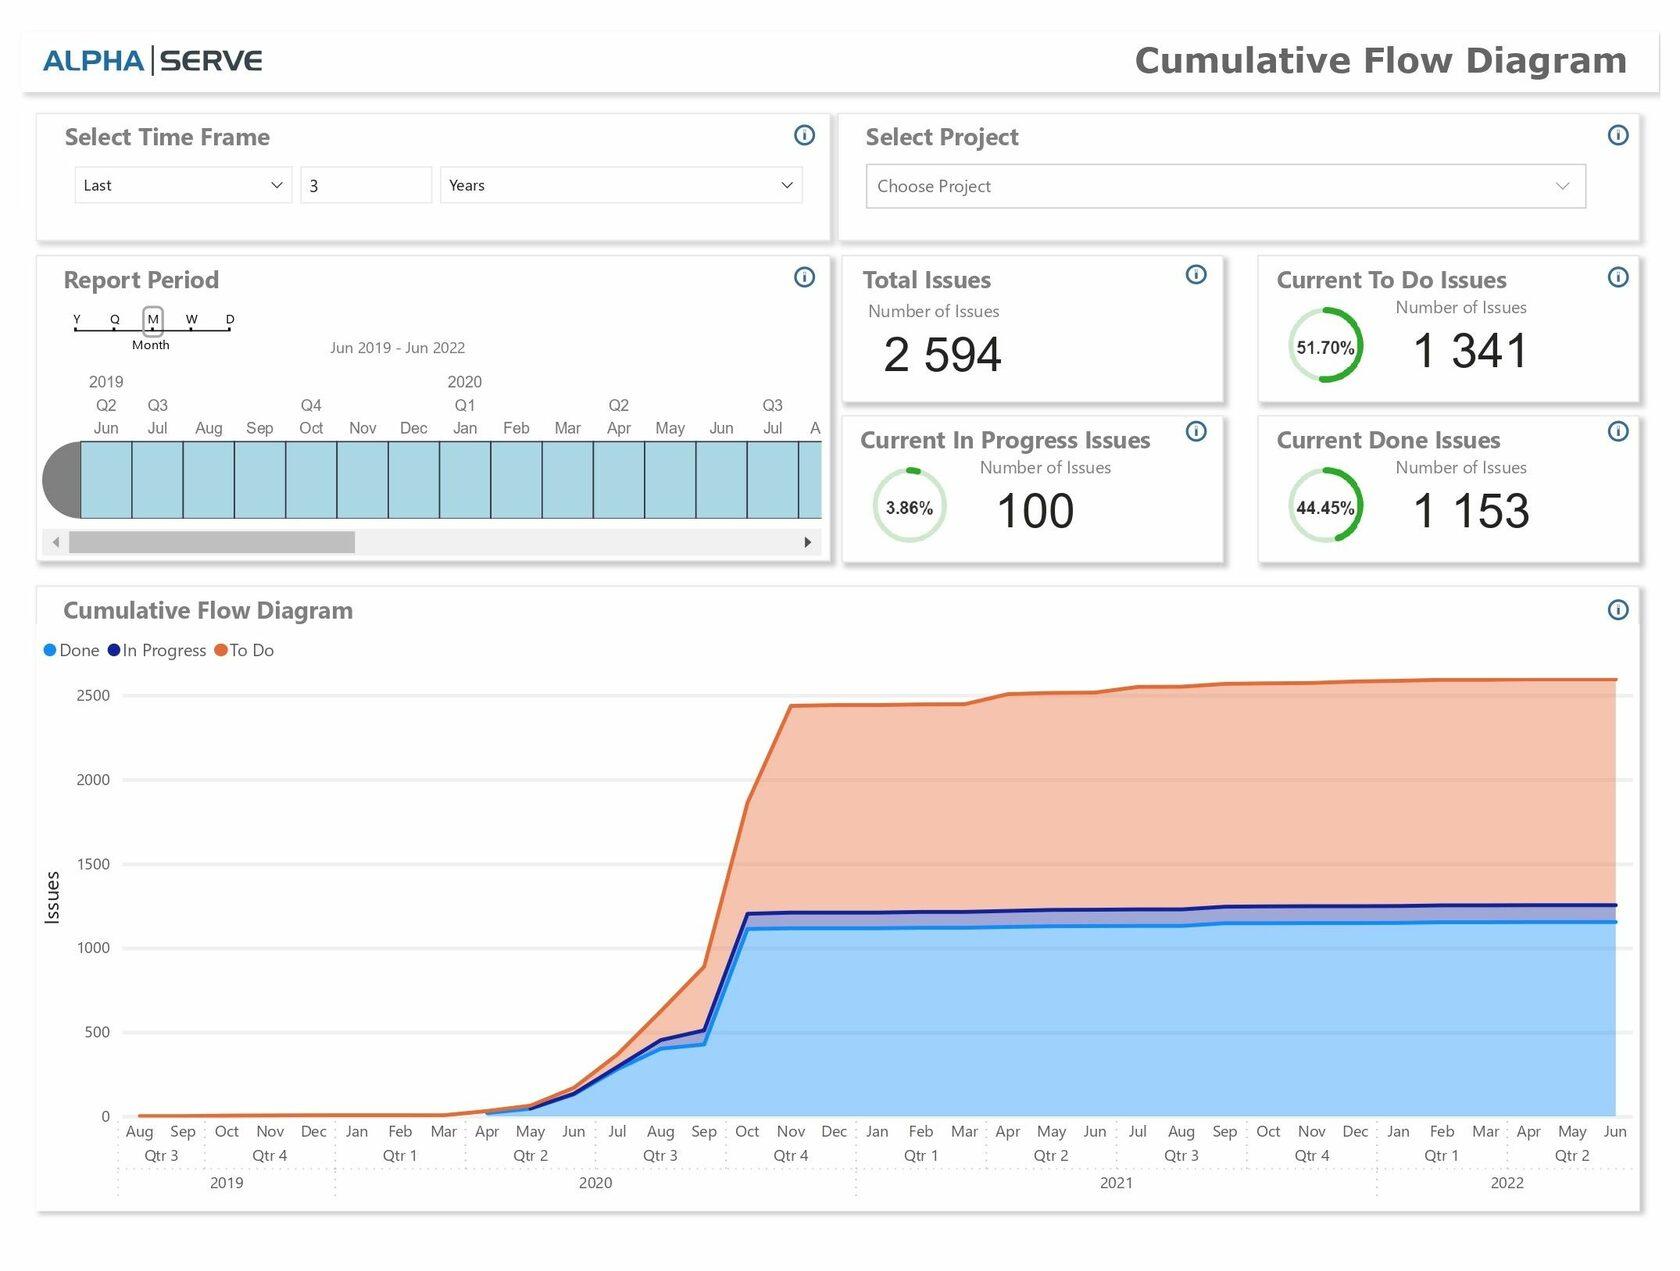
Jira Cumulative flow diagram visualizes how many issues are passing through each status and shows the various statuses of the Jira project's issues over time.
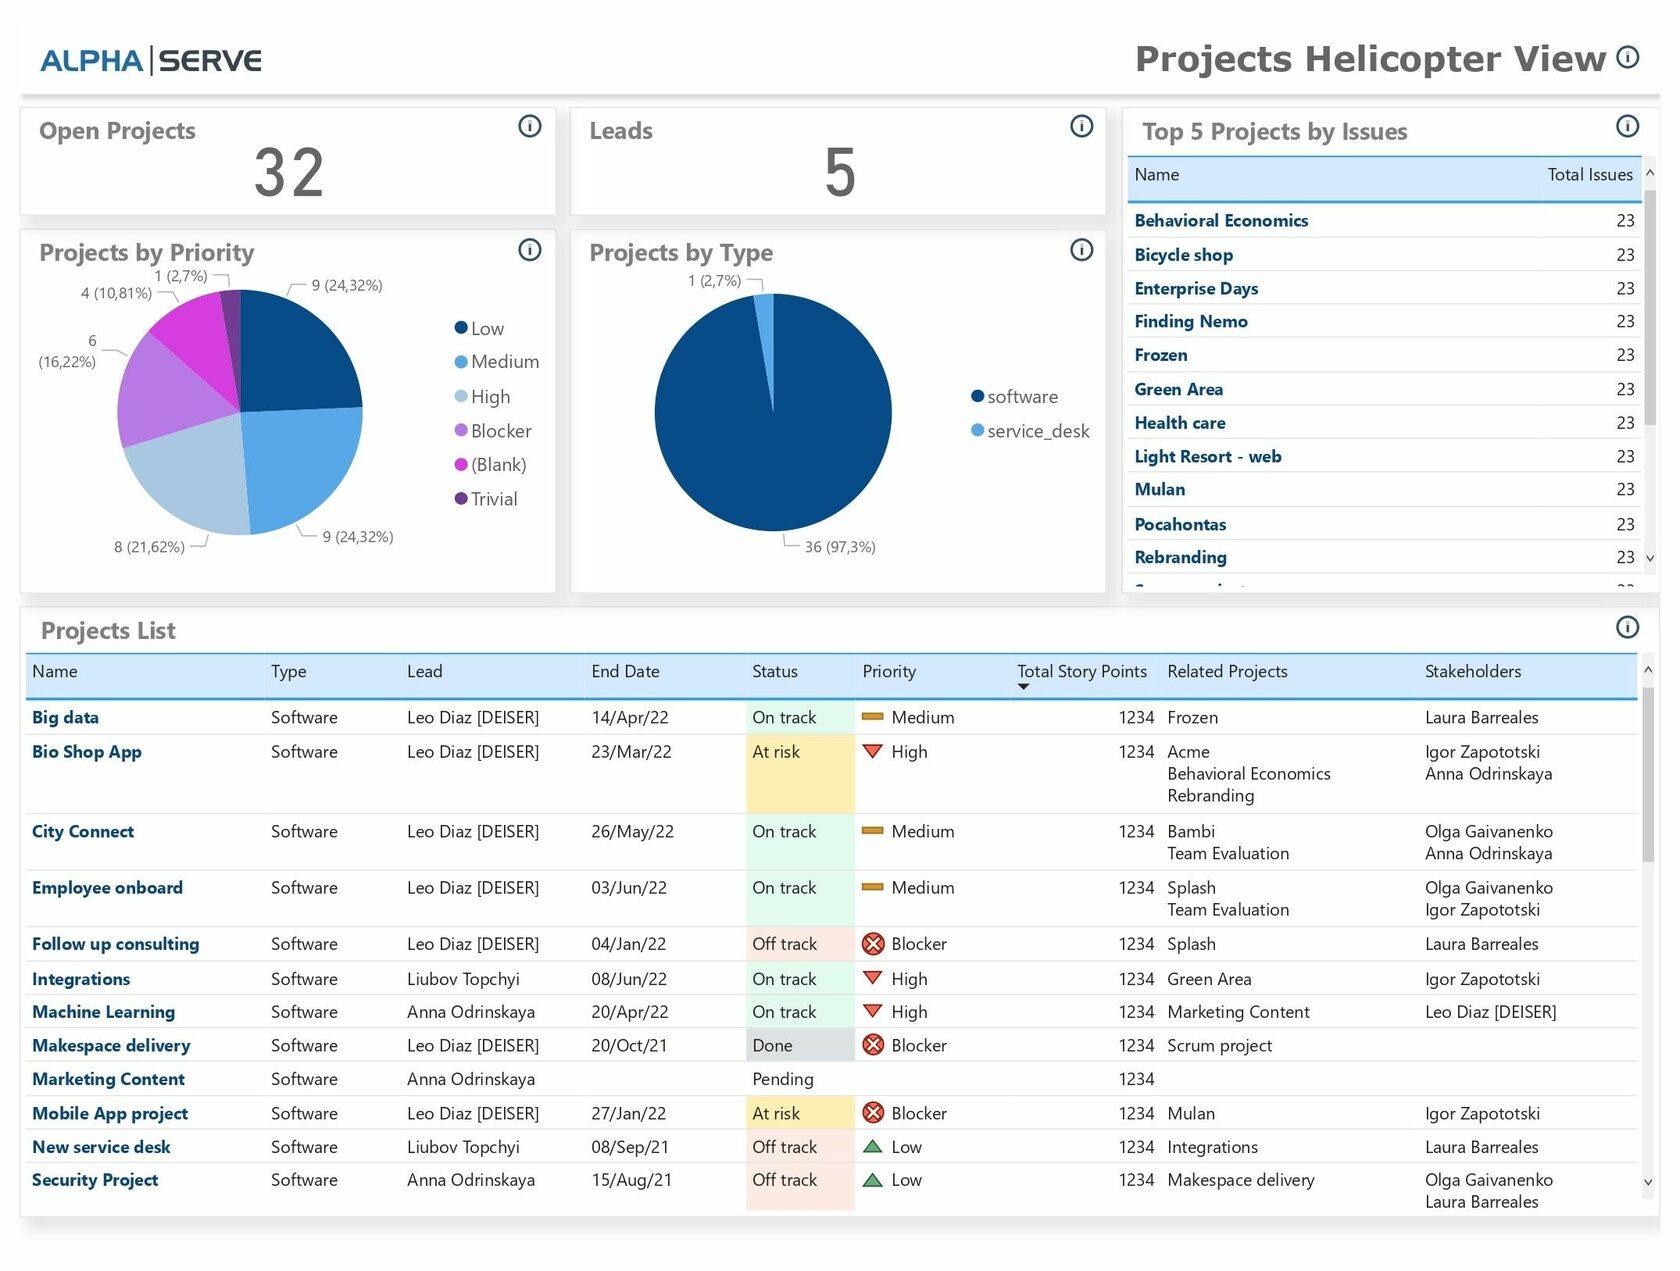
Project Helicopter View is built based on Jira + Projectrak app data and is available for Jira Cloud only. It is a big-picture view report that shows the overall projects that are currently open, their types, and the number of projects managed by one team lead.
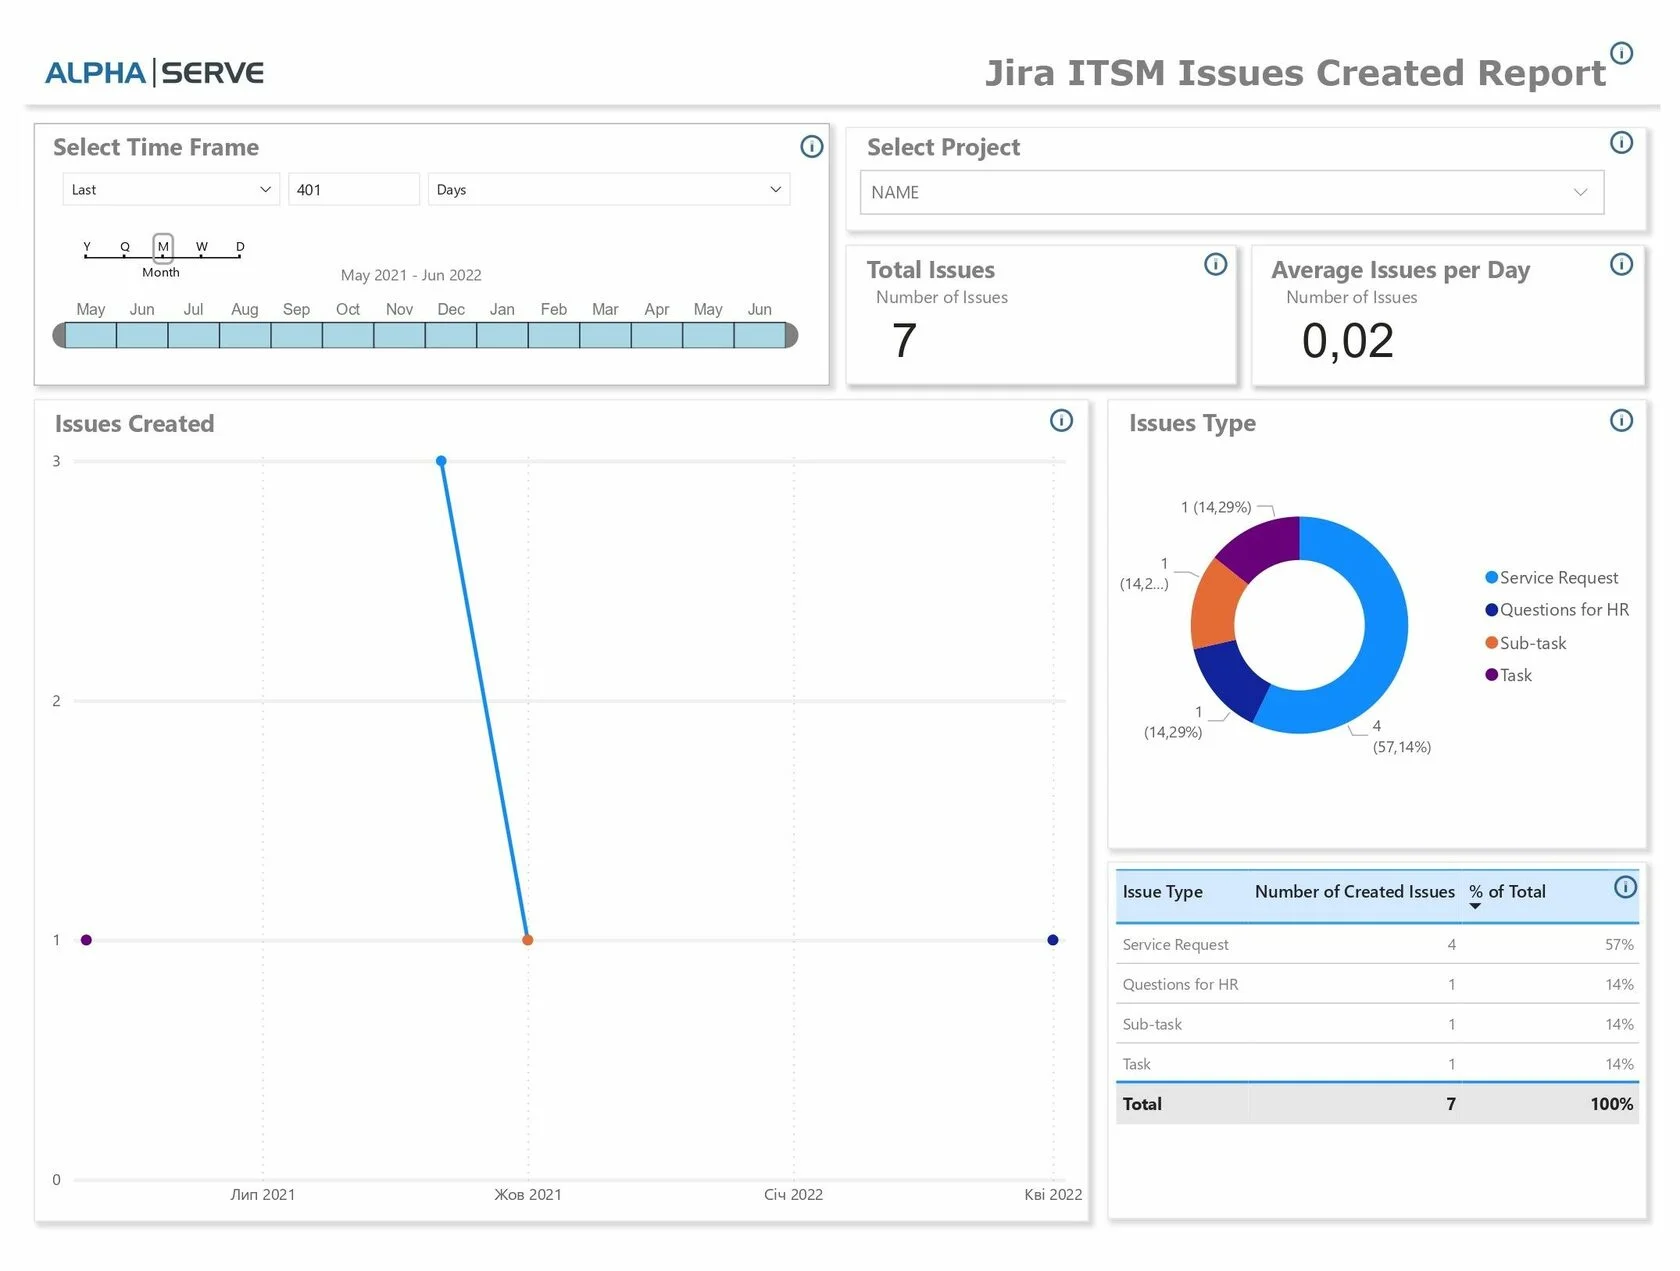
Jira ITSM Issues Created Report displays the full issues overview per certain project and time period, the share of issues per type and/or priority.
Here is a short step-by-step instruction on how to use Power BI dashboard templates:
Go to the Templates tab.
Pick the template you want to use and click on its name or the Create Data Source button.
Set up the auto-generated data source. You need to fill in the data source name, and description and apply filters (if needed). Click Next.
Copy the generated data source URL and click the Next button to download the dashboard template .pbit file to your computer.
Open Power BI Desktop. Go to File > Import > Power BI template and select the .pbit file you’ve downloaded before.
Insert the data source URL into the corresponding field.
Go to Basic Authentication and fill in your credentials. Click Connect button.
That's it. You have created your first Jira report based on the template you chose.
For more detailed information about Power BI Connector for Jira dashboard templates check the documentation.
Use a business requirements document template to align teams, clarify goals, and streamline project planning for successful execution.

CapEx vs. OpEx explained: 7 key differences, how to balance both budgets, and the classification mistakes that trip up most finance teams.

While the distinction may seem trivial, there are far-reaching implications to choosing which option is right for your organization.

Conducting a cost-benefit analysis can help you better understand a project’s viability before you pour time and resources into it.

Your developers don't want to do manual time tracking – this is how and why you should connect Tempo Timesheets to GitHub, GitLab, and BitBucket.

Learn what lean management is, how to use it in project management or organization-wide, and general details about the lean system and principles.

Great products have great design. PMs need to understand and speak the language of designers. We’ve uncovered what designers wish you knew.

Introducing two new tools built on Atlassian’s AI platform, Rovo: the Structure Formula Assistant and the Sprint Performance Assistant.
Projects can stall for no reason. Read on to learn how to reengage in the project and finally finish it.