Unified portfolio visibility – from Jira dashboards to BI analytics [recording]
Bridge the gap between day-to-day delivery and executive visibility


Key Takeaways
How to share live and executive-ready reports in Confluence that go beyond copy-paste
Learn how to track health, risk, budgets, and outcomes with confidence.
How BI Connectors bring Jira data into Power BI / Tableau for forecasting and financial analysis
Practical use cases showing how reporting flows from team level to the boardroom
When projects scale, your reporting can’t stay static
Discover how to turn project data from Jira data into clarity for your team, alignment for executives, and insights for analysts.
Watch this on-demand webinar where Tempo’s experts will walk through building portfolio views from your Jira instance, publishing executive dashboards in Confluence, and sending curated datasets to BI for deeper analysis.
You will receive a practical blueprint for standardizing metrics, accelerating decisions, and scaling reporting without ripping out and replacing your existing stack.
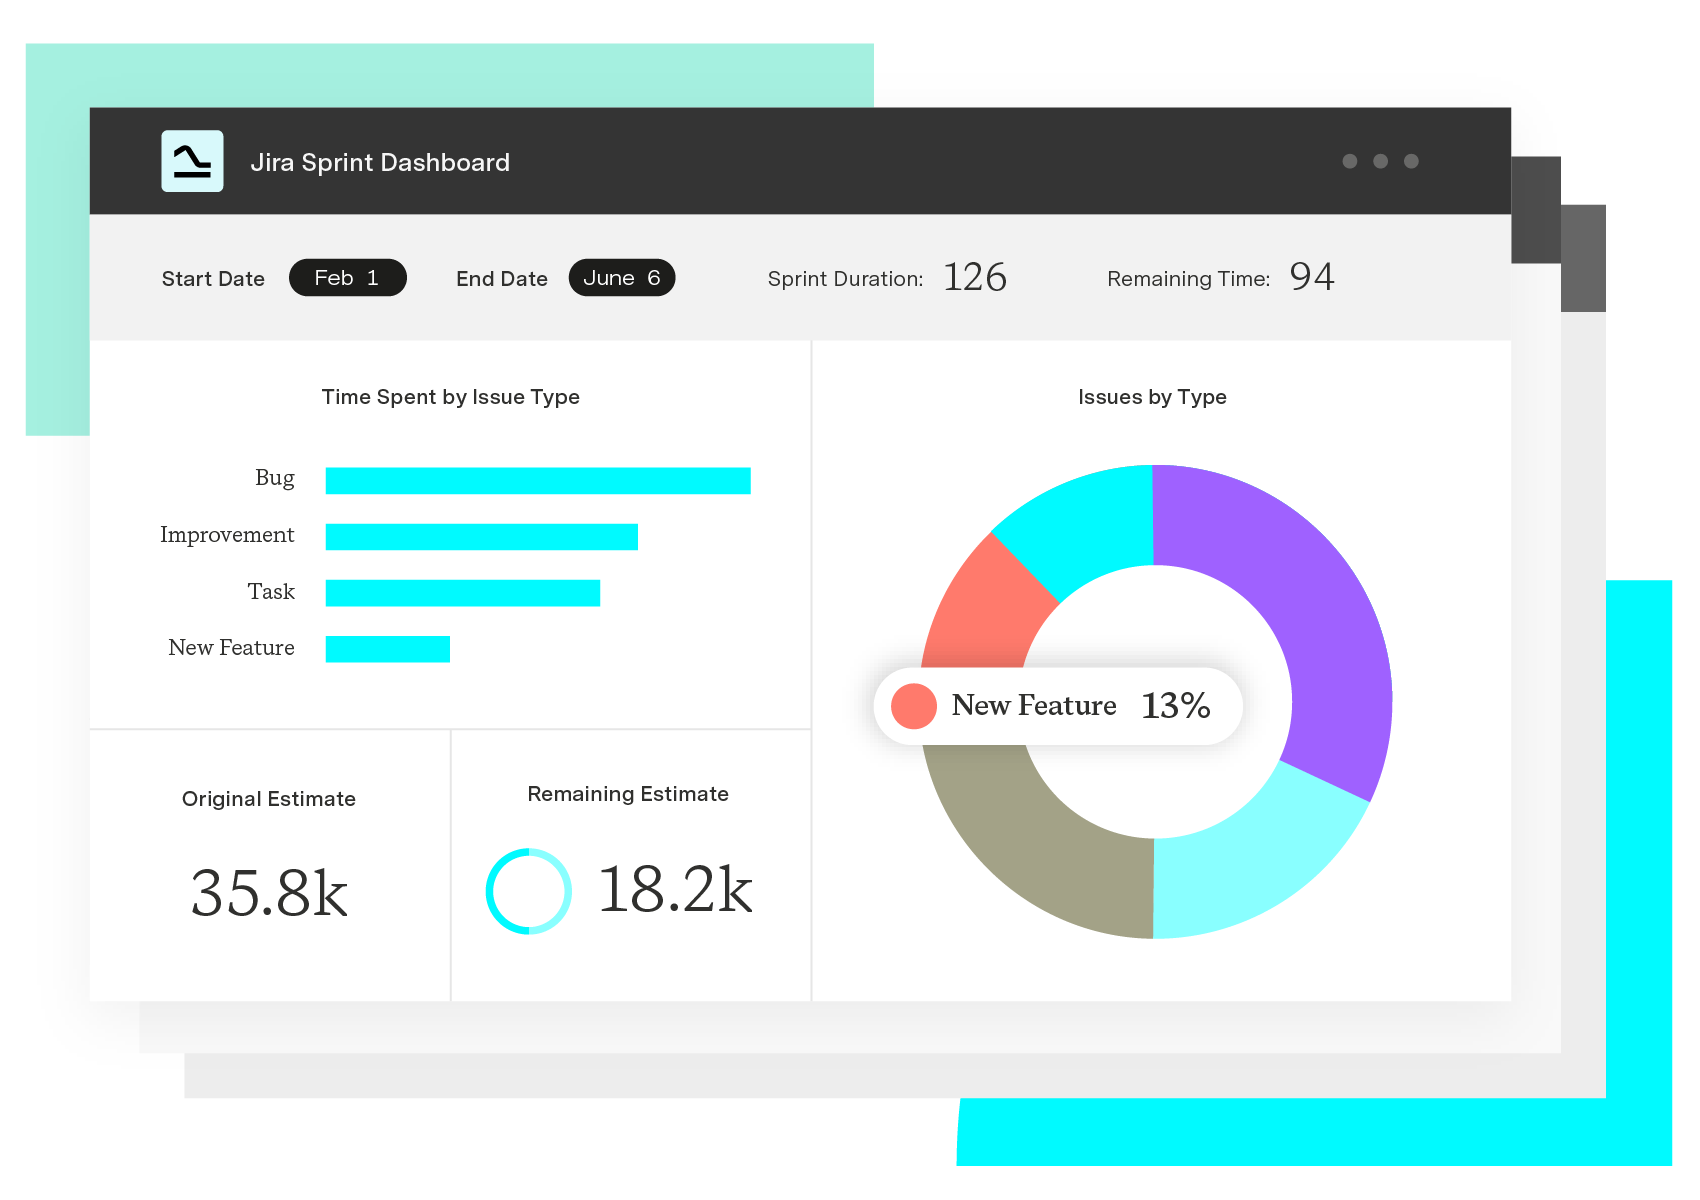
Custom Charts for Jira
A dashboard for every occasion
Build charts and dashboards to evaluate delivery, capacity, and speed for all teams with Jira's most flexible custom reporting app
Start a Free Trial