How our updated Formulas language unleashes more data for easier decision-making
Tempo Team
Originally published June 29, 2021
The latest on-prem version of Structure PPM dramatically improves the accessibility of Jira data, so you can create clearer visibility into your projects. You can catch warning signals earlier and make better, faster decisions as a result.
How? We’ve taken one of our best features, Formulas, and put it on steroids! More functions, easier access to even more data, just straight-up more.
This means you can use things like issue links, work logs, related epics or stories, parent tasks or sub-tasks, additional properties within versions or sprints, and a host of other items you couldn't readily access from your formulas previously. You can extract data from these values and efficiently assemble project metrics, indicators, and other values.
Here are some examples of how organizations might use these new capabilities.
Get clearer insights — with less work
Say you want to get a prediction date for when a team will finish an epic. To do this, you need to find the finish date for stories on the epic level. In prior versions of Structure, you would have to create structures that included all the related stories. With Expr 2.0, you don't need to.
Expr 2.0 lets you query information from issues linked to those present, without needing to build structures that include everything. There's no need to build a massive structure with all the stories in it — because the stories are linked to your epic, you can query the information and get the answer.
You accomplish this simply with (be sure to set the format to date/time):
MAX(epicStories.sprint.endDate)
With Expr 2.0, you can answer all sorts of questions, such as: How many unresolved issues are blocking this other issue? How many blocking dependencies are in another project? Is this issue blocking other projects — and if so, which ones? And you can do it without putting in the time and energy into creating large, complicated structures to get that data.
Perform statistical analysis without extra tools
Another example: Say you want to analyze team performance — specifically, you're interested in team velocity, and want to spot any anomalies that indicate a team is struggling.
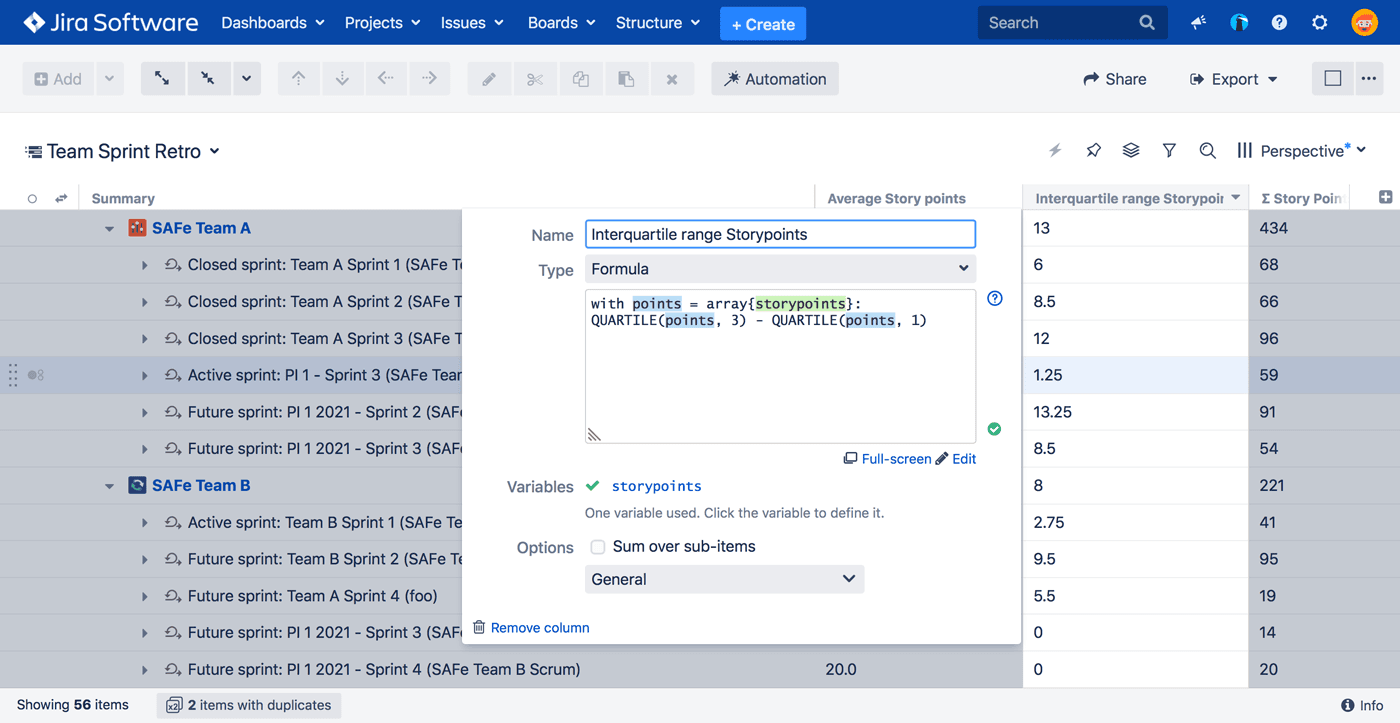
You can answer this question with Structure 7 — without having to export data to Excel (or any other tool) to do the calculation. You can calculate the mean story point estimate for all issues, as well as interquartile range, to see the estimated work variance as well as the same calculations on work logged for those issues.
To calculate the interquartile range you would simply write:
WITH points = ARRAY { storyPoints } : QUARTILE(points, 3) - QUARTILE(points, 1)
This uses a local variable, points, to hold all the story points of the children.

Or, suppose you want to analyze which tasks are getting neglected as they get lost in the handoff between teams. Many organizations see cycle time grow because teams aren't tracking tasks that aren't anyone's official responsibility. Now, you can better understand that situation by calculating the 5th and 95th percentile for issues in statuses like "transitions from submitted to investigating" or the range of time in "testing," or "in review."
Learn more about Expr 2.0
Those examples just scratch the surface of what Expr 2.0 enables users to do. This system is robust and flexible enough that users can take these capabilities and apply them to their own unique situations, finding the best and most innovative uses all on their own. We built this software, now users can go and do truly awesome stuff with it.
There are a number of resources to help users understand what Expr 2.0 does and get ideas for how to apply it. We suggest you bookmark the Formulas page on our Structure wiki, which includes:
As always, our support team is available to get you over any obstacles. Please don't hesitate to reach out if you get stuck. We'll gladly help you unlock the power of these improvements!
Sign up for a demo
Register


