

See how to use MOCHA in project management and learn how this framework, combined with the right tools, clarifies team roles and responsibilities.

One of the greatest project management challenges is group coordination. It’s high stakes to get this right, since team collaboration can make or break a project.
Especially for large, complex projects with diverse, cross-functional teams, having clearly defined roles and responsibilities removes confusion and frustration from the team’s execution and decision-making. Work and approvals flow more smoothly, leading to happier, more productive staff and less stress on project managers.
A project management tool that helps you achieve this coveted state is the RACI chart. It’s a simple roles and responsibilities matrix that defines who does what throughout a project, clarifying communication and preventing duplicated efforts.
In project management, a RACI chart is a Responsibility Assignment Matrix (RAM) that defines each stakeholder’s level of involvement. Using a spreadsheet or table, you add the list of tasks from your project plan and assign roles to team members based on the RACI acronym: responsible, accountable, consulted, and informed.
This category designates the person or group who will perform the task. They’re the doers, completing the hands-on work according to project requirements and timelines.
Responsible parties can include:
Project managers
Business analysts
Developers
Graphic designers
Copywriters
If tasks are more complex and responsible parties need to delegate, you can convert the RACI chart to RASCI by adding an extra column to the table labeled S for supportive. This addition can help project managers track additional personnel working on the project.
The accountable stakeholder assigns tasks to responsible parties and communicates requirements, expectations, and timelines. They’re also in charge of the outcome’s final approval and delivery.
Stakeholders who usually assume accountability are:
Product owners
Signature authorities
Business owners
Sponsors
Key stakeholders
Within the RACI framework, consulted parties are those whose current or future work may be impacted by a project task. They offer input and feedback to those responsible throughout every stage of the task’s execution.
Not every project task requires consultation, and too many voices can slow the development process. Consider limiting consultants to one per task, included only when necessary.
A few examples of consulting parties are:
Subject matter experts
Information security and cybersecurity experts
Compliance consultants
You must loop these stakeholders in on project progress but don’t necessarily need to consult them on decisions. And you might include them as optional attendees in the project kick-off meeting and any project demos.
Informed parties include:
Project sponsors
External stakeholders
Business owners
One of the main pitfalls of the RACI matrix is that team members often need clarification on what it means to be responsible versus accountable. Take time to explain the difference when reviewing the chart with them.
Responsible parties are task-oriented. This might be a single person or team who generates and delivers the assigned work according to specifications and deadlines.
Accountable team members are outcome-oriented. They communicate expectations, milestones, and progress and are the final approvers upon task completion. They’re also answerable if a task or project falls short.
Get the most out of your RACI chart by following a few simple rules when drawing it up:
Assign at least oneresponsible party to each task.
There should be no more than one personaccountable for each task.
Balance the chart to ensure no team member is overloaded with responsibility.
Assign every team member a role for each task. It’s not unusual for team members to assume the informed role for most items.
Ensure the RACI chart is accessible so the team can review their roles and track changes.
As valuable as it is, not every project requires a RACI chart.
If you’re managing a project for a small, established team with a successful track record, they’re probably already adept at solving communication and process issues. Consider skipping mapping roles and responsibilities and assigning tasks to team members directly.
For more complex projects with multiple cross-functional teams and tasks that run concurrently or have significant dependencies, try the RACI model. It’s particularly useful when:
Decision-makers or approvers could hold up project progress
There’s conflict regarding task ownership and decision-making
Team members are coping with an uneven workload
Turnover means you need to onboard a new member quickly
The main benefit of making a RACI chart is clearly tracking roles and communicating responsibilities. This tool also assists managers in the following ways:
Clarifying expectations: The RACI model establishes who’s responsible for completing or managing the work going forward. This visualization means team members can quickly see their level of involvement in each task and plan their workflow accordingly.
Facilitating decisions and approvals: Consulting the RACI chart helps project managers know who to involve in decision-making or sign-off and when. Looping in the right people at the right time reduces delays to speed up project progress.
Avoiding opinion overload: The consulted and informed designations help limit the feedback project managers need to act on or incorporate into the work. And fewer stakeholders making demands or offering ideas decreases the risk of scope creep.
Bypassing silos and reducing overwork: Using a delegation tool like a RACI chart helps managers distribute responsibility and knowledge across the team, decreasing the possibility that misunderstandings cause project delays. It also helps ensure no team member is overwhelmed by too much responsibility.
A RACI chart is a straightforward project planning tool you complete after establishing your work breakdown structure (WBS), project roadmap, and PERT chart. To build your matrix, you can use an online template, Excel, or a simple table in your word processor. No matter your chosen method, here’s a five-step guide to creating an effective chart.
The first step in creating a RACI matrix is to consider who’s involved in the project and whether you should identify them by name or role in the chart. Specifying roles is useful when a single team member fulfills multiple functions or if there are various teams responsible for deliverables. Names are simpler and build clarity if several people are filling similar roles.
Whatever you choose, add them to a row at the top of the chart.
Next, list project tasks and deliverables found in your WBS and project plans, adding them to the far-left column. You don’t need to go into great detail defining the tasks, keeping it as simple as possible to avoid overcomplicating the chart.
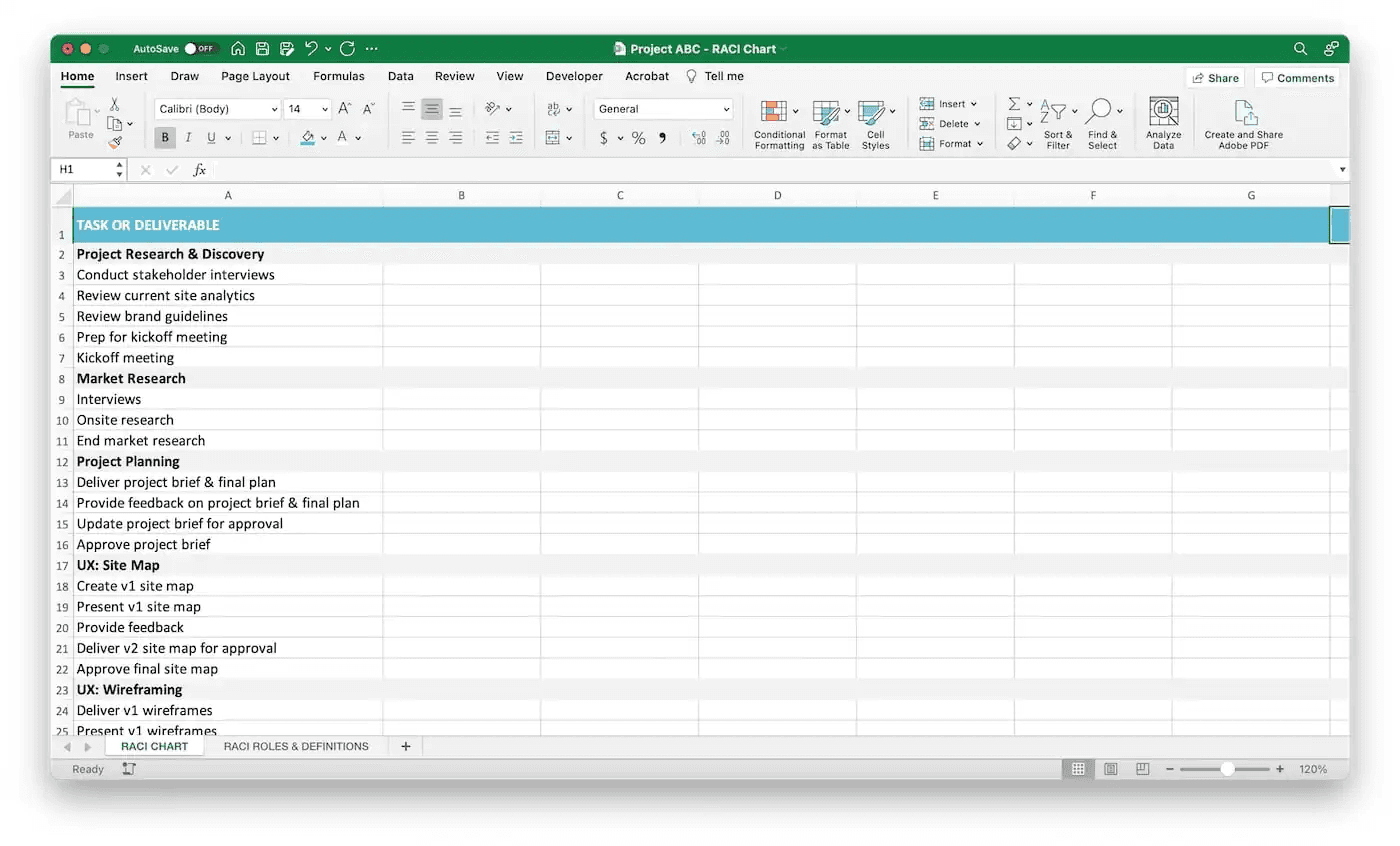
Source: Teamgantt
Once you’ve set up the chart, start handing out assignments. Working systemically, designate roles to each task, assigning at least one responsible person and one accountable party.
Think carefully about consulted and informed team members. If you’ve completed a stakeholder analysis, you can use this information to fill out your chart.
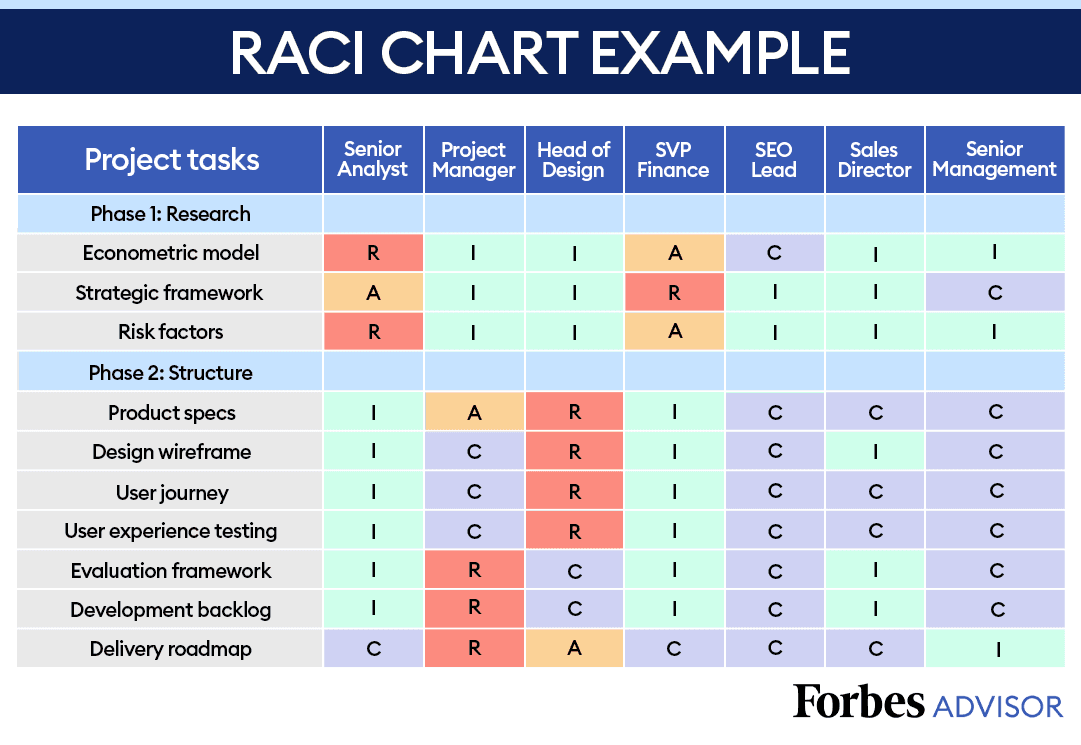
Source: Forbes Advisor
Now that you’ve completed the chart, sit down with your team to review their assignments. Seek and incorporate their feedback as much as possible until everyone is satisfied with the division of labor. Then, meet with core decision-makers and stakeholders to review the RACI chart and secure approval.
Store the document in an accessible place and refer to it regularly to ensure the team remains aligned on project roles and responsibilities. Encourage everyone to review their responsibilities throughout project work and ping the team when changing this chart.
During project closure, assess your chart in a retrospective meeting to determine how well the assignments worked and whether staffing was adequate.
Get a leg up when it comes time to build your project’s RACI chart by leveraging Strategic Roadmaps by Tempo to create an audience-friendly roadmap. Strategic Roadmaps can help your team visualize tasks, identify dependencies, and establish priorities, facilitating collaboration and project plan alignment.
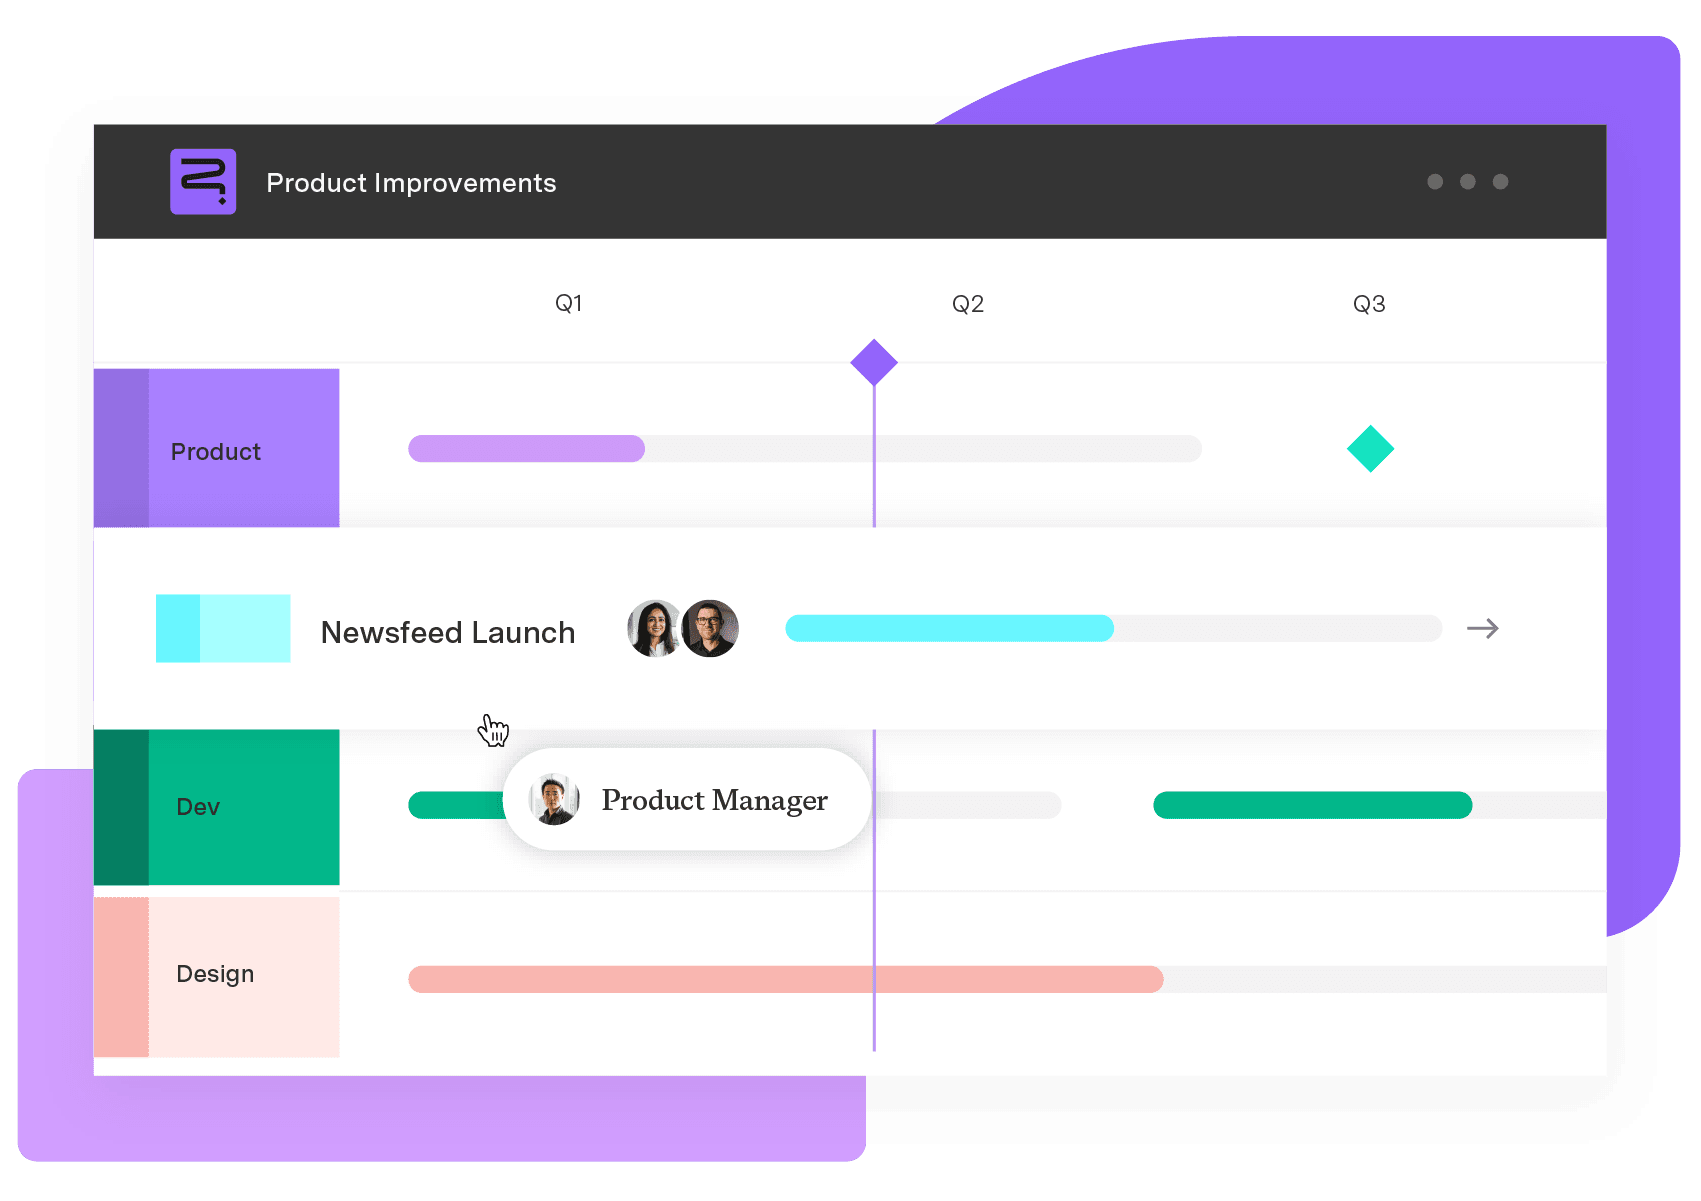
Strategic Roadmaps
Build your portfolio vision with Strategic Roadmaps. With powerful visualization capabilities, you can communicate strategy to the entire organization and gain alignment around strategic objectives, product goals, and milestones.
Start a Free TrialSee how to use MOCHA in project management and learn how this framework, combined with the right tools, clarifies team roles and responsibilities.

Learn how to turn annual goals into 90-day targets with structured quarterly planning that supports alignment, adaptability, and measurable progress.

Take control of your project management tasks by implementing project planning tools to foster collaboration and increase team productivity.

Learn about the seven factors that go into a project plan to set you up for success. Plus, explore project plan examples to guide your process.

Learn the best practices for professional services project management to optimize workflows and build a more successful business.

In this blog post, we’ll discuss how your workplace can enable and even improve team collaboration, even when faced with several challenges.

A matrix organizational structure blends project experts with leadership teams, enabling agile resource use and better cross-functional collaboration.

Discover secrets behind effective task management and workflows by learning Jira best practices to incorporate into your project management practice.

Learn to execute effective project governance. Manage project risks, align teams, ensure quality management, and engage key stakeholders.

















