
Pie, bar, line charts - you name it
Extend and enhance your reporting with many more chart types than you get from standard Jira.
See how work is progressing and where blockers are with Jira's most flexible custom reporting app. Build charts and dashboards to evaluate delivery, capacity, and speed for all teams, from agile and ITSM to marketing and HR.



Tempo is trusted by 30,000+ global companies
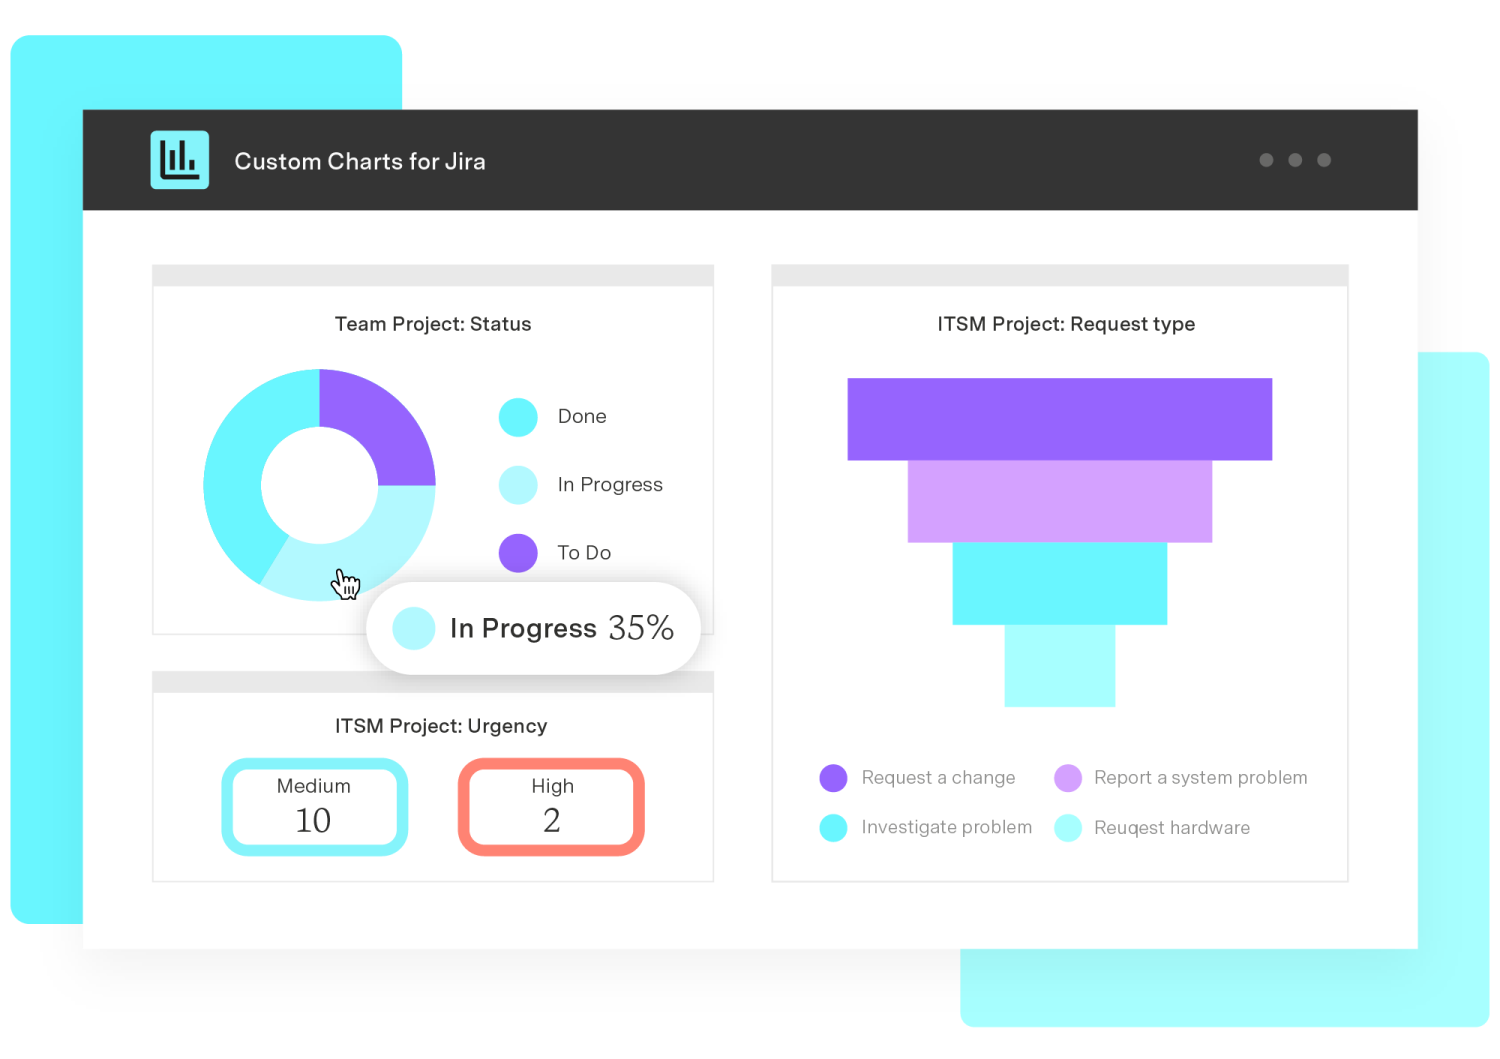
Report on various metrics including time in status, cumulative spend, sprint progress, and more.

Fully customize the tracking of your sprint progress, velocity, time in status, blockers, and more to fit your project's requirements.

Understand the bigger picture and see how work is progressing across all corners of your organization. Complex reporting made easy.

Share read-only charts and reports with customers in the JSM portal or display fully interactive dashboards on Confluence pages.

Intuitive no-code charts and dashboards for users at any level. Report on what you want with ease.
Unmatched in its capabilities, no other application delivers this level of customized reporting seamlessly integrated into a Jira dashboard. With Custom Charts, you gain the unique ability to craft a diverse array of detailed charts using just a single, versatile gadget, transforming your data visualization and reporting into an art form tailored exactly to your needs.

Extend and enhance your reporting with many more chart types than you get from standard Jira.

We designed Custom Charts to be accessible and intuitive to all abilities. Get your team reporting right away – no training necessary.

A single tool for visualizing and sharing all your most crucial metrics – from time in status, cumulative spend, sprint progress, and more.
“I have seen the app go from strength to strength and actually solve a major issue within native functionality. While Jira is strong at searching data with all the custom fields, presenting that information back in a useful manner is a different matter.”
Dan Tombs
Atlassian Administrator and Agile Lead, intelliflo
Get the most of your data by reporting on custom fields from Scriptrunner, Jira Workflow Toolbox, Xray Test Case Management, and many more, or enjoy the seamless integrations with Timesheets and Structure PPM by Tempo.

Build beautiful reports from all kinds of custom fields from the other tools your teams use.

Connect Custom Charts to other Tempo tools for rapid reporting and to get closer to full strategic portfolio management over your entire workflow.
“With Custom Charts, I was able to build dashboards for development and product teams to analyze KPIs to understand where we need to put our focus.”
Nikolay Marov
Head of Development
Offer stakeholders and collaborators visibility and transparency across as much work as you want by sharing charts and whole dashboards outside your Jira instance.

Share an entire Jira Dashboard with internal or external users of Jira Cloud or display your most important stats in your Jira Service Management portal or internally with wallboards.

Don’t use Jira but use Confluence? Custom Charts for Confluence can create and share all kinds of highly visual and customizable charts in a matter of clicks.
“With Custom Charts you can easily fill the feature gaps that Atlassian currently has for Jira Service Management reporting. It is easy to use and set up.”
Arto Kovalainen
Lead Consultant
Access a free trial of Custom Charts

Marianne Gosselin
Chief Information Officer
"Custom Charts is just so intuitive. It lets you build what you want quickly, with the freedom to tell the data story you want to tell, not the one the tool makes you tell."
Featured customer stories
intelliflo widens access to financial advice through leading technology which powers the financial advisory experience.
Challenge
The primary challenge intelliflo faced was the inefficiency of their Salesforce platform due to a large volume of data and complex workflows. This resulted in sluggish system performance and hindered productivity for their users.
Solution
Custom Charts provided intelliflo with a customized solution to optimize their Salesforce platform. They implemented a data archiving strategy to manage the large volume of historical data, improving system performance and user experience. Additionally, they optimized workflows and automated processes to streamline operations and enhance productivity for Intelliflo's users.

Testimonial
People use to come and say, I’d like my report to show this. And we’d have to respond, sorry, you can’t. That’s what’s so great about Custom Charts. It has everything you would need – a great variety of chart types, the ability to group and slice the data, customization, and if you’re comfortable enough writing JQL, then that’s a really powerful feature. Custom Charts has moved a lot of our reporting back into Jira, which is where we want everyone working.
Dan Tombs
Atlassian Administrator and Agile Lead
Custom Charts for Jira
Ensure your company's data is completely secure and that you're in compliance with the latest standards.








Tempo tools integrate with tools your organization already uses, right out of the box.
Tempo's products help teams increase productivity and communicate across their organization.
Create and share all kinds of highly visual and customizable charts directly on your Confluence pages.
Learn moreTempo’s intuitive automation and Jira-native design make it the most trusted time tracking tool for enterprise organization.
Learn more
The roadmapping tool designed for high-performing teams delivering boardroom-ready strategic roadmaps.
Learn moreCouldn't find what you need?Go to ourHelp Center
Custom Charts provides dashboard gadgets and macros that allow you to add dynamic charts that look great and are easy to build.
If you'd like to ask us a question about Custom Charts, please raise a ticket in our support portal
No need to export static charts to display them elsewhere, Custom Charts for Jira and Custom Jira Charts for Confluence are two separate apps, allowing near-identical experiences so you can create beautiful reports in both places.
Custom Charts has identical features on the Cloud, Server, and Data Center. Migrating from Confluence Server and Data Center to Confluence Cloud works seamlessly. Simply export a page, space, or entire instance and import it to your Confluence Cloud site. When you install the Cloud version of the Custom Jira Charts for Confluence app your charts will be configured exactly as before.
All charts can be exported directly as a PNG, PDF, or CSV file.
Custom Charts supports Jira system fields and custom fields, as well as fields from third-party apps.
Access a free trial of Custom Charts