7 time consuming things an average Joe spends on in a lifetime
Tempo Team
Have you ever wondered how much time you spend on certain activities in a lifetime? When our day-to-day activities are summed up into a lifetime, it can be frightening to see how much of our lives goes into these tasks. We’ve put together seven time consuming things an average Joe spends on in their lifetime.
1. Sleeping
A good night’s sleep is vital for every human being to survive. Given that an average a person sleeps for 8 hours in a day, that means that an average person will sleep for 229,961 hours in their lifetime or basically one third of their life. That’s precious time which could have been spent watching Die Hard 105,325 times.
2. Eating
Eating is a necessary part of life that we must do in order to survive. A study done in the US said that an average American spends 67 minutes per day eating and drinking beverages. Summed up together, the average Joe spends a staggering 32,098 hours eating and drinking beverages in their lifetime.
3. Driving
Cruising down the street on a hot summer day with Radar love by the Golden Earrings playing in the car stereo can be a great joy, but driving can also be kind of a drag. According to a study done by the Harvard Health Watch, an average American spends 101 minutes per day driving. That means that in a lifetime, an average Joe spends a whopping 37,935 hours driving a car (assuming that s/he starts driving at 17 and drives until 78.7 years old). In that time, average Joe will drive around 798,000 miles (1,284,256 kilometers), which is approximately the distance it takes to drive to the moon more than three times!
4. Working
Work is a big part of our life and our biggest source of income, but how much time do we actually spend working? Let’s say that average Joe works 40 hours a week, from the age of 20-65 and gets two weeks of vacation every year. In that time, average Joe will have worked a total of 90,360 hours of his life working for the man.
5. Surfing the internet
In the past decade, the impact of the Internet has exploded, becoming an integral part of our everyday lives. We work, shop, socialize, play games, educate, read news, and do so many other things online. A study done in 2010 tells us that an average American spends 32 hours per month online. That totals 28,300 hours in a lifetime, and this number may increase in the future with smart devices becoming more commonly used and allowing easier access to the Internet.
6. Watching TV
Most of us love watching TV as a leisure activity. According to the US Bureau of Labor Statistics the average American watched TV for 2.8 hours per day, accounting, on average, for around half of their leisure time. That means an average person will watch over 9 years’ worth of TV, or around 80,486 hours. To put that into perspective, you can watch all of the Friends episodes over 838 times.
7. Cleaning
Unless you’re Mary Poppins, you probably don’t like to clean very much; unfortunately, it’s something that most of us have to do. According to this article, women will spend 12,896 hours in their lifetime cleaning the home, which is almost one-and-a-half years of their lives. It may not be a huge surprise that men spend less time cleaning in their lifetime as compared to women. Men spend around half of that — or 6,448 hours in their lifetime cleaning.
William Penn once said “Time is what we want most, but what we use worst.” We may not always be able to control how we spend our time, but we can try to make the most of it.
The best way to gain awareness — the first step towards change — is to find an objective system of measurement that cuts through the power of human rationalization. After all, perception and reality are often two different things. When you track your time, you get a healthy dose of the unfettered truth. Then you can start spending time on what’s most important.
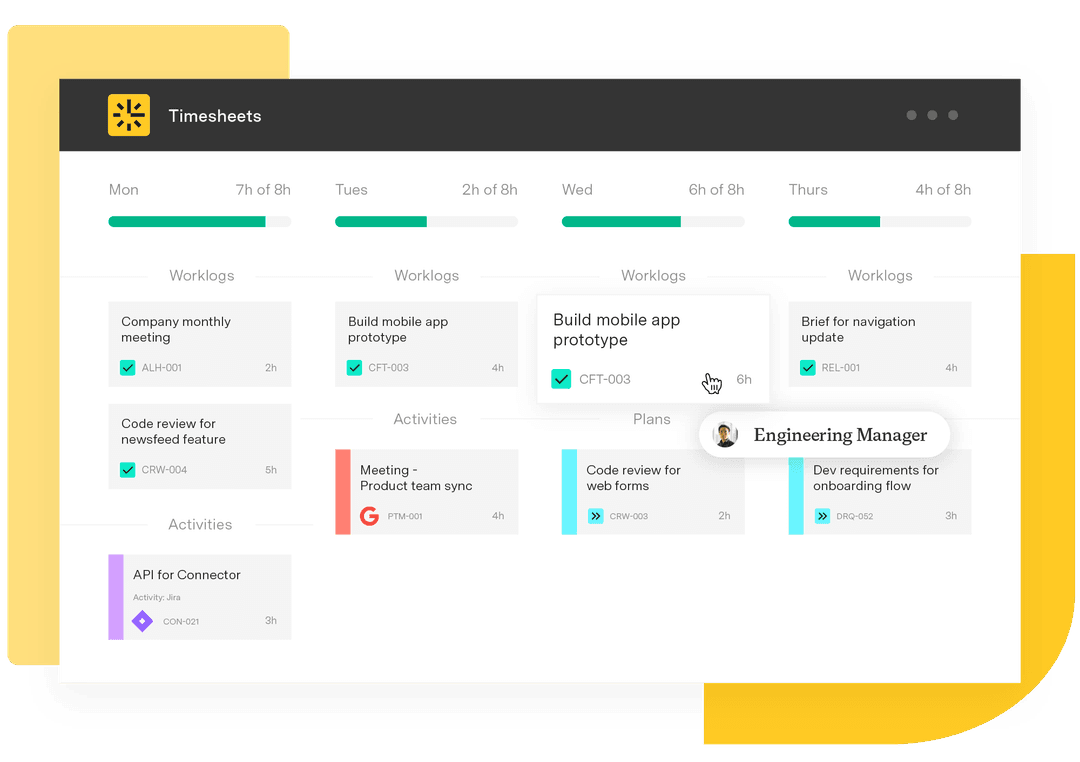
Our Jira time tracking software, Tempo Timesheets, helps users to not only easily and objectively track their time and productivity, but to figure out how they might best change their behavior to meet their goals. For most of us, time tracking is more about making every hour count than it is about counting every hour. That is, time tracking is not just about awareness: it’s about change. Perhaps this is the crux of why time tracking means getting things done: hours don’t lie. When you realize how you spend your time, it makes clear where your priorities are -- or ought to be -- and it shows you how you might make your time better match your priorities.
Sign up for a demo
RegisterSources
Does not account for time spent multitasking
The calculation were based on the life expectancy that average joe will live to be 78.7 years old according to life expectancy at birth for the U.S. population in 2011
Year was calculated as 365,25 days or 52.2 weeks.
When calculating how much time is spent driving we assumed that an average Joe would drive from the age of 17 till his death.
When calculating time spent online we estimated that a person would start using the internet at the age of 5.
Sources:


