
Most professional services firms know their numbers a month after they would have been useful. Utilization, realization, and margin reports arrive in a deck pulled together from spreadsheets, exported timesheets, and a finance system that does not speak to delivery. By the time leadership sees a slipping engagement or a sliding utilization rate, the quarter is already shaped. Analytics is how services leaders shorten that loop – turning delivery data into decisions while the engagement is still in flight.
What is professional services analytics?
Professional services analytics is the practice of measuring how a services business actually runs: utilization, realization, project margin, forecast accuracy, and client profitability. It connects time, capacity, and cost data to the engagements that produced them, so leaders can see not just what happened but why.
Done well, analytics for a services firm answers four questions on demand. Are we billing the time we are working? Are we delivering at the margin we sold? Are our people loaded at the right level? Are our forecasts holding up against reality? When those questions take a week to answer, the firm runs on instinct. When they take an afternoon, it runs on evidence.
Why analytics matters for professional services firms
Services businesses live and die on small percentage points. A few points of realization across a delivery org can fund a new practice. The same drift in utilization can close one. The leaders who catch those shifts early – inside the quarter, not after – are the ones who can act on them.
Analytics also exposes the gap between what was sold and what is being delivered. Fixed-price engagements quietly burn senior hours. Time-and-materials projects under-bill because hours never get logged against the right account. A retainer client absorbs scope creep that nobody priced. Without a connected reporting layer, those leaks stay invisible until they show up as a margin miss.
The third reason analytics matters is forecasting. Pipeline alone does not tell a services leader what is achievable next quarter – capacity does. Connecting actuals to plans is what turns a hopeful forecast into a defensible one.
Benefits of analytics with Tempo
Real-time delivery KPIs. See utilization, billable hours, and project status without waiting for a manual roll-up.
Estimated vs. actual reporting. Compare what was scoped to what was delivered – at the engagement, team, or client level.
Custom dashboards. Build the views your finance, delivery, and PMO leaders each need, instead of reformatting one report for everyone.
Connected to source data. Reports pull directly from Jira and time entries, so the numbers leadership sees match the work consultants logged.
How Tempo enables professional services analytics
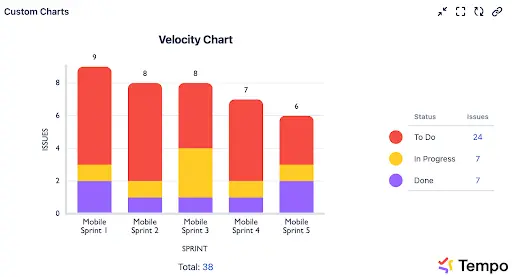
Tempo's analytics layer for services firms combines three products. Custom Charts for Jira is the visualization surface – a tool that lets non-technical stakeholders build dashboards in Jira and Confluence without learning JQL. Practice leads, finance partners, and PMO directors can each shape the view they need from a shared data source.
Professional Services Automation (PSA) Demo 2023
Timesheets supplies the time-and-billing truth. Every billable and non-billable hour is captured against Jira work, classified by account, and made available to reporting. Custom Charts then surfaces that data as time per client account, billable vs. non-billable mix, estimated vs. actual hours, and utilization trends over time – all without exporting to a BI tool unless you want to.
Financial Manager adds the cost and revenue layer. Project labor costs, rates, expenses, and budgets sit in one place, fed automatically by Timesheets data so there is no manual import. Together, the three products turn delivery activity into financial signal: which clients are profitable, which engagements are eroding margin, and which patterns to estimate against next time.
For firms that want to push data further, Tempo's BI Connectors send Jira and Tempo data into Power BI, Tableau, BigQuery, or Looker Studio – useful when finance and delivery analytics need to live alongside the rest of the business.
Sign up for a demo
Request Demo


