What is a time spent report?
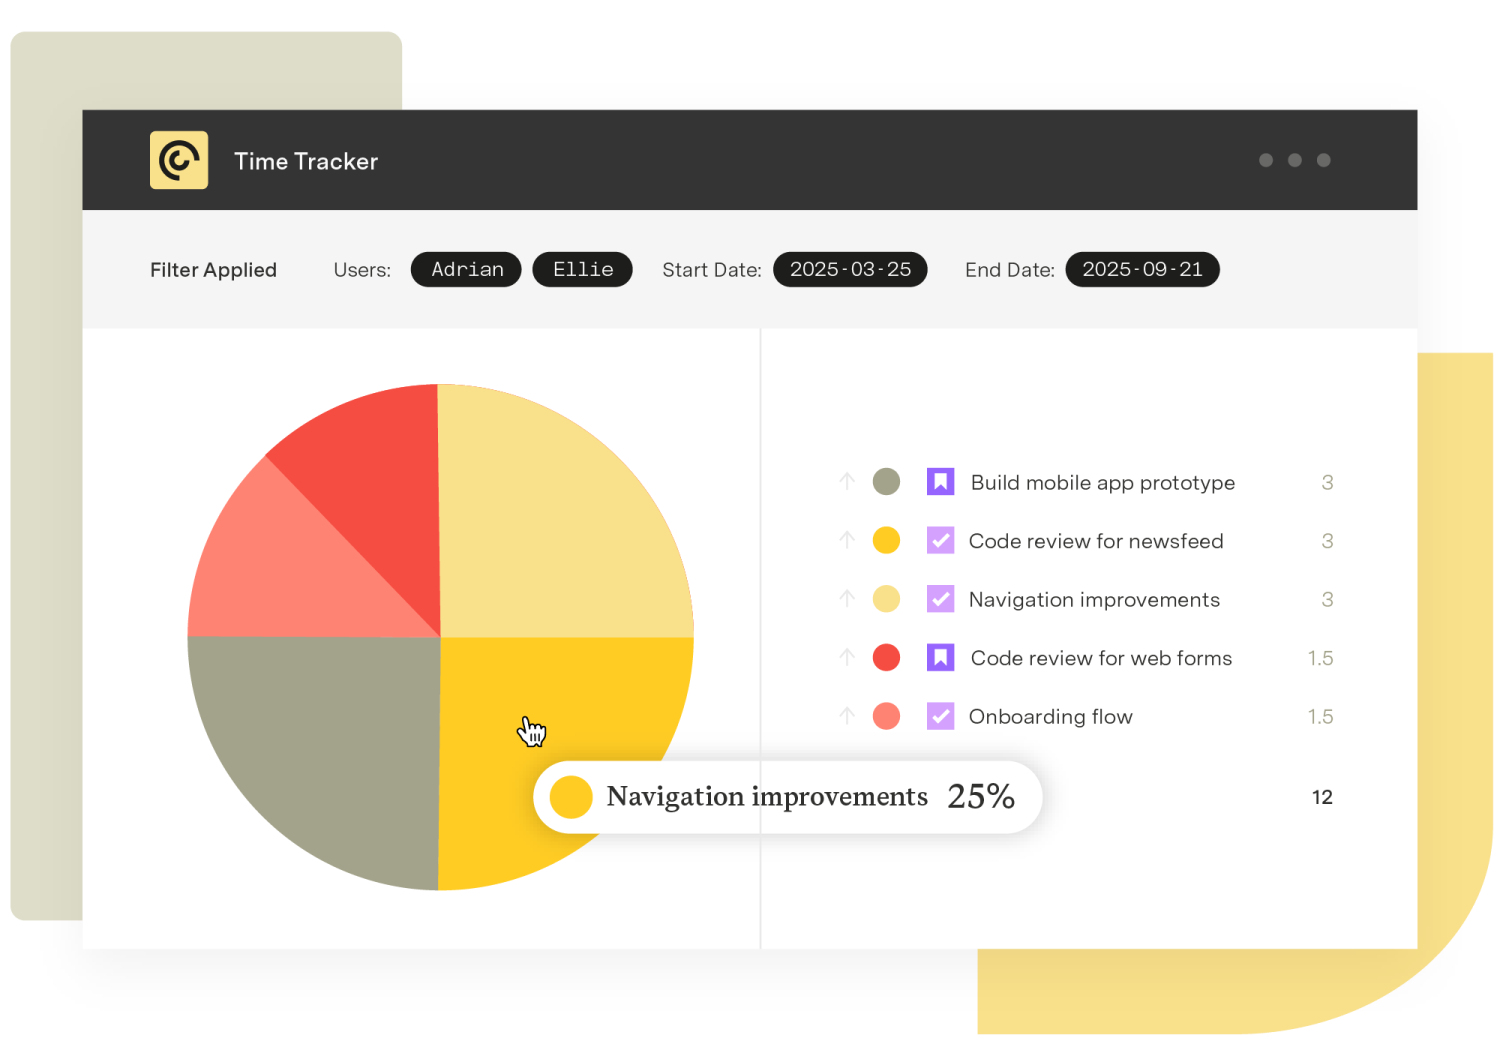
A time spent report aggregates Jira time-tracking data and presents it as a breakdown of how time was distributed across whatever dimension matters – status, issue type, project, label, assignee, or epic. It is a backward-looking view: this is where the work went.
The dimensions are the point. The same underlying data answers very different questions depending on how you slice it. By status, it tells a workflow story. By issue type, it tells a delivery-mix story. By project or label, it tells a focus story.
A useful time spent report is not a single chart. It is a flexible cut of the same data, shaped to the question at hand.
Benefits of a time spent report
Reality check on priorities. Strategy decks rarely match where time actually goes; the report makes the gap visible.
Workflow diagnostics. Time spent in each status surfaces queues, blockers, and stages that quietly absorb effort.
Sharper estimates over time. Comparing time spent on completed work against original estimates feeds better forecasting.
Clearer sense of overhead. Time spent on bugs, support, and unplanned work shows up against time spent on planned delivery.
How to use a time spent report
A practical workflow:
Pick the question first. "How much time did Project Atlas consume?" is a different report from "Where in the workflow are issues spending the most time?"
Set the time window – a sprint, a quarter, a release cycle.
Choose the primary dimension, usually status, project, or issue type.
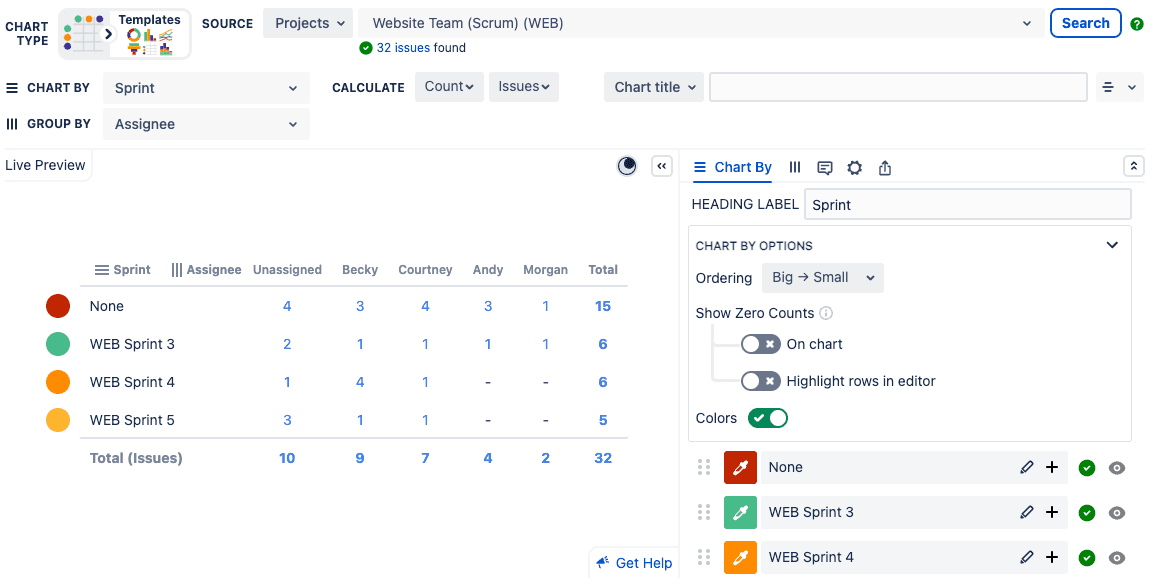
Layer in a secondary dimension to find the patterns. Time per project is interesting; time per project per status is actionable.
Compare against estimates where you have them, and use the gaps as the start of the conversation rather than the end.
Time spent reports are most useful when they feed a decision – a process change, a capacity reallocation, an estimation reset – rather than living as a passive dashboard.
Running the time spent report with Timesheet Reports & Gadgets
Timesheet Reports & Gadgets (also referred to as Prime) is a separate Jira app from Timesheets. It is a lightweight reporting layer that extends native Jira time tracking with prebuilt, configurable reports, and the time spent report (sometimes labeled Timespent) is one of them.
Inside Reports & Gadgets, the time spent report shows how time logged against Jira issues breaks down across statuses, issue types, and labels. The status view is the differentiated cut: it surfaces how long work actually sits in each step of the workflow, not just the total spent on the issue.
Because the data is anchored to Jira issues, time spent reports stay consistent with the work leadership is already tracking. Reports can be saved, surfaced as Jira dashboard gadgets, or subscribed to by email, so the right stakeholders see the numbers without anyone exporting spreadsheets.
This is distinct from Timesheets, which is the enterprise-class time tracking and billing product with accounts, CapEx or OpEx classification, and full invoicing. Reports & Gadgets is the right fit for teams who want straightforward, Jira-native time and status reporting without the wider compliance and finance footprint.
Sign up for a demo
Request Demo