Resolution time report

Resolution time report

How long does it actually take your team to close work? A resolution time report turns the gap between promise and delivery into a number you can see, compare, and improve – straight from the Jira data your team is already creating.

What is a resolution time report?

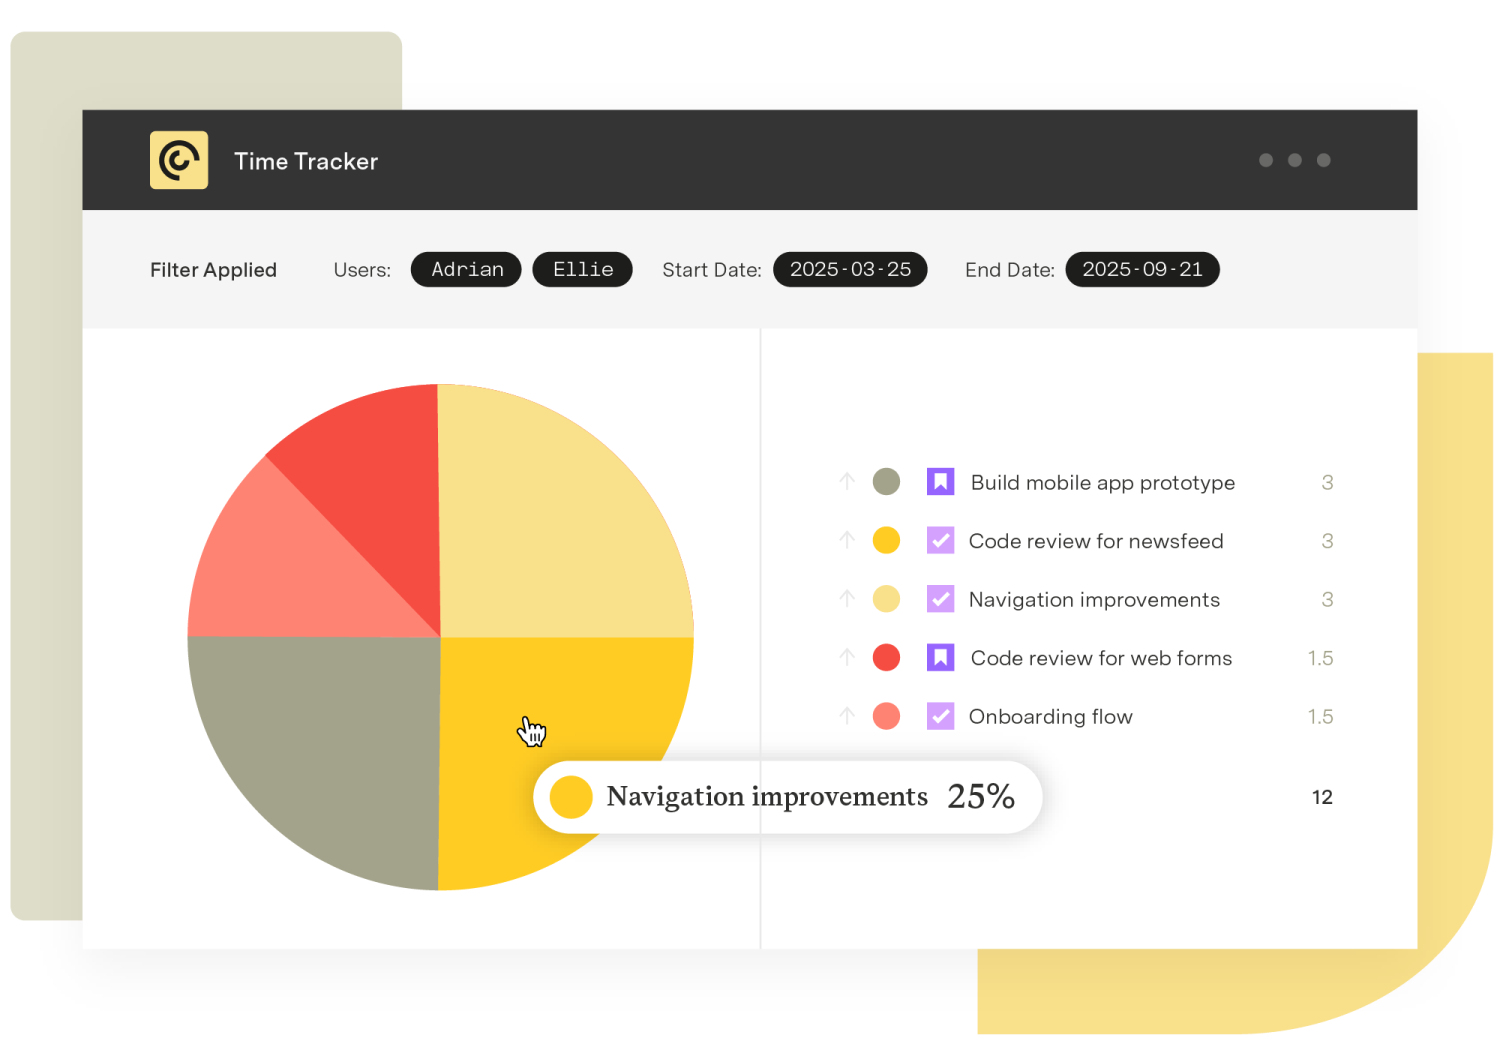
A resolution time report measures the elapsed time between when an issue is created and when it is resolved. Pulled from Jira, it tells you how long stories, bugs, support tickets, or any other issue type sit in your workflow before they close.

The headline metric is usually an average or median, but the real value sits in the breakdown – by status, issue type, priority, assignee, project, sprint, or label. That is where the patterns live.

A good resolution time report is less about declaring "we are fast" or "we are slow" and more about answering the next question: where is time being lost, and what kind of work is losing it?

Benefits of a resolution time report

  • Shared definition of speed. Everyone arguing about velocity gets a concrete number anchored in actual closing times.

  • Early warning on workflow problems. Aging tickets and rising medians show up in the report before they show up as escalations.

  • Better SLA management. Support and operations teams can spot trends against committed response and resolution windows.

  • Honest retrospectives. Sprints are easier to debrief when "we were slow" turns into "P2 bugs took 40 percent longer than P3 bugs."

How to use a resolution time report

A typical analysis flow looks like this:

  1. Define what "resolved" means in your workflow – the specific status transition that closes the clock.

  2. Choose the cohort of issues to study, usually a project, a sprint range, or an issue type.

  3. Run the report and look at the distribution, not just the average. A handful of stale tickets can drag the mean badly.

  4. Slice by priority, assignee, status, or label to find the segments driving the long tail.

  5. Pair findings with workflow analysis – which status is holding the work? Where is it going stale?

The report itself is the diagnosis. The fix usually lives in queue management, triage practices, or scope.

Running the resolution time report with Timesheet Reports & Gadgets

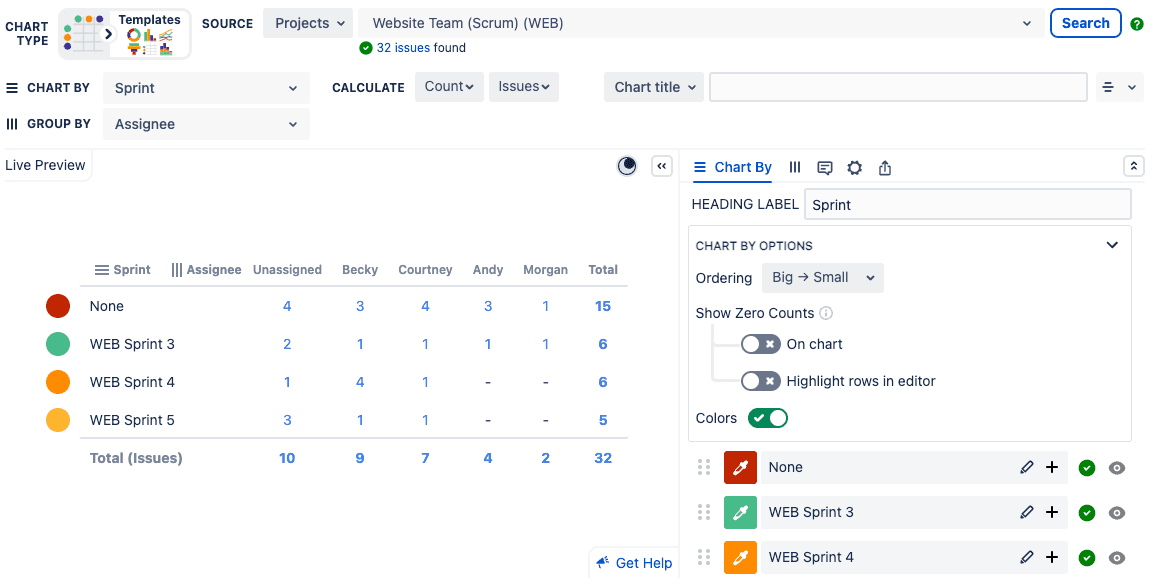
Timesheet Reports & Gadgets (also referred to as Prime) is a separate Jira app from Timesheets. It is a lightweight reporting layer that extends native Jira time tracking with prebuilt, configurable reports – and the resolution time report is one of them.

Inside Reports & Gadgets, the resolution time report breaks elapsed time down by status, so you can see how long issues sit in each step of your workflow rather than only the headline create-to-close number. That status-level view is what turns the report from a vanity metric into a workflow diagnostic.

Because the data comes straight from Jira issues, the numbers reconcile with the work leadership is already tracking. There is no separate analytics stack to maintain, and reports can be surfaced as Jira dashboard gadgets or subscribed to by email so the right stakeholders stay current.

This is distinct from Timesheets, which is the enterprise-class time tracking, billing, and CapEx or OpEx product. Reports & Gadgets is the right fit for teams who want simple, Jira-native reporting on the time and status data they already have.

Resolution time report examples

A platform engineering team uses the resolution time report to track how long P1 incidents stay open, broken down by service. They discover one service consistently exceeds the others and use that signal to prioritize a refactor.

A customer support team running on Jira reviews weekly resolution medians by ticket category. The pattern shows account-access tickets resolving four times faster than billing tickets, which redirects training investment toward the slower category.

A product team uses sprint-level resolution time reports to debrief stretch goals. They find stories estimated at three points routinely take eight days, and re-anchor their estimation conversations around real data instead of historical guesses.

Reports & Gadgets in Tempo Timesheets

Capture, approve, and report on time logged in Jira.

Other Popular Features

related-content-image

    related-content-image

      related-content-image

        related-content-image

          related-content-image

            related-content-image

              related-content-image

                related-content-image

                  related-content-image

                    Streamline your workflow, in-and-out of Jira

                    Tempo's products help teams increase productivity and communicate across their organization.

                    Tempo’s intuitive automation and Jira-native design make it the most trusted time tracking tool for enterprise organization.

                    A powerful team resource management tool designed to optimize capacity planning and project management in Jira

                    Visualize all your Jira data & manage portfolios of projects in real-time.

                    The roadmapping tool designed for high-performing teams delivering boardroom-ready strategic roadmaps.

                    Frequently Asked Questions

                    Couldn't find what you need?Go to our

                    Timesheet Reports & Gadgets and Timesheets are two different Jira apps. The resolution time report lives inside Reports & Gadgets and analyzes Jira status and resolution data – elapsed calendar time, broken down by status. Timesheets is a separate, enterprise-class product focused on logged hours, billing, accounts, and CapEx or OpEx classification. If you want to know how long an issue took to close, you want this report. If you want to know how many billable hours someone logged against it, you want Timesheets.

                    Resolution time usually measures from issue creation to issue closure. Cycle time typically measures from "in progress" to "done" – it ignores the time an issue waited in the backlog. Lead time often measures from request received to value delivered, which can extend past Jira closure into deployment. Pick whichever metric matches the question you are trying to answer; the trap is using one and pretending it answers all three.

                    Two common approaches: cap the report window so very old tickets fall out of the cohort, or read the median alongside the average so a few outliers do not move the headline number. The deeper fix is workflow hygiene – aging tickets that nobody intends to do should be closed as won't-fix rather than left to inflate the metric.

                    Generally not. The moment resolution time becomes a personal scorecard, behavior changes – tickets get closed prematurely, scope gets carved down, and the data quality collapses. It is most useful as a team-level diagnostic, surfaced in retrospectives and used to drive process changes rather than individual reviews.

                    Start optimizing your time

                    Access a free trial of Timesheets.