Every estimate is a small bet. The team commits to a number, the work starts, and the actuals roll in over the next two weeks. Compare the two and you learn something useful: where scope creeps, which tickets sandbag, which engineers consistently come in light. With that comparison, planning gets sharper every sprint.
What is estimated vs actual time?
Estimated vs actual time is a reporting view that places a Jira issue's original or remaining estimate next to the time logged against it. The estimate captures what the team thought the work would take. The actual reflects what it took.
The gap between those two numbers is where teams find their planning intelligence. A small, consistent variance suggests estimates are calibrated. A large variance points to scope ambiguity, dependencies the team did not see, or interruptions that pulled focus elsewhere. Tracked over time, these comparisons turn anecdote into pattern.
Most Jira teams have the raw inputs already – story points, time estimates, worklogs – but lack a clean way to surface the comparison without exporting to a spreadsheet. A dedicated estimated vs actual report closes that gap inside Jira itself.
Benefits of estimated vs actual time reporting
Sharper sprint planning. Historical variance gives planners a defensible buffer instead of a hopeful one.
Earlier risk signals. When actuals trend above estimates mid-sprint, leads can rebalance work before the demo turns into an apology.
Honest retrospectives. Teams stop debating who was busy and start discussing why specific issue types keep blowing past their estimates.
Fairer billing and capitalization. Comparing logged time to plan supports billable invoicing, CapEx and OpEx classification, and audit-ready records.
How to use estimated vs actual time
Start at the issue level. Pull a report scoped to a single sprint or epic, sort by variance, and look at the outliers. The tickets where actuals exceed estimates by 50% or more are the ones worth examining – not to assign blame, but to understand the cause. Was the spec underspecified? Was a dependency late? Did testing surface rework that no one had budgeted for?
Roll the same view up to the team or project level for a planning conversation. Look at average variance by issue type, by component, or by assignee. Patterns at the team level usually point to systemic issues: a chronically underscoped category of work, a meeting load that is eating into delivery time, or a hand-off that adds days no one tracks.
Managing estimated vs actual time with Tempo Timesheets
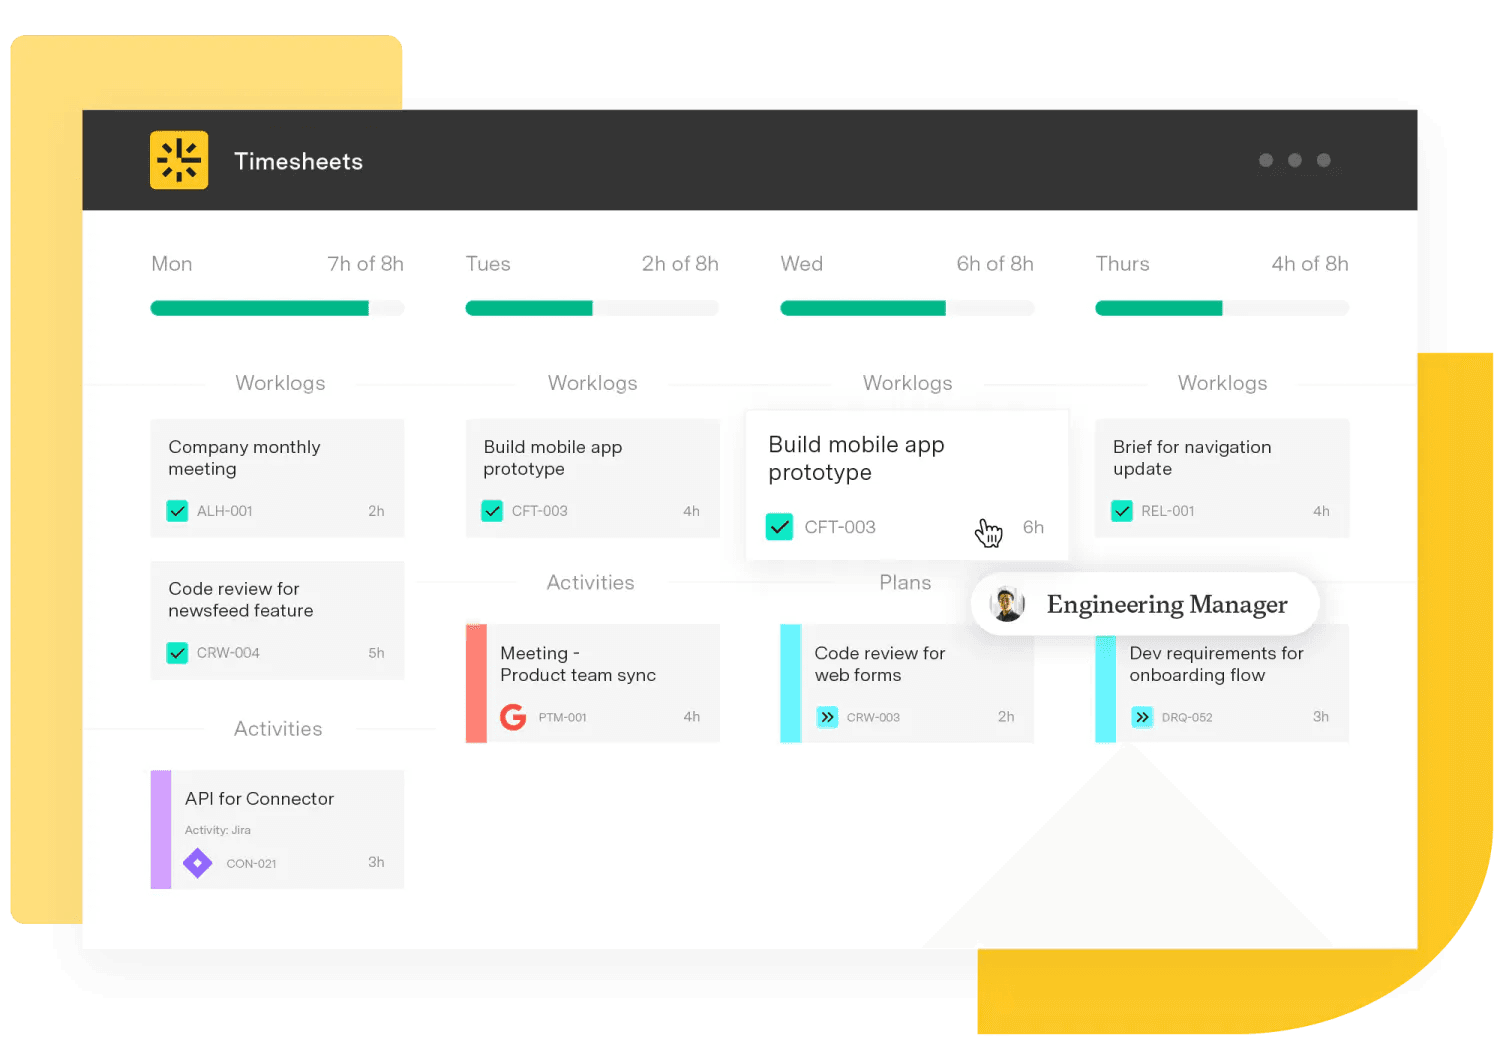
Timesheets pulls the actuals side of this comparison directly from worklogs. Because logging is automated through calendar, Slack, and IDE integrations, the time data underneath the report is closer to reality than manual entry would deliver – the most common reason estimated vs actual reporting fails is bad actuals, and Timesheets fixes that at the source.
Reports surface logged time alongside Jira's original and remaining estimate fields, so leads can see plan versus reality without leaving Jira. Filters by team, account, project, and issue type let project managers drill from a portfolio overview down to a single contributor. Tempo Accounts adds a financial layer on top, separating billable from non-billable hours and tagging time as CapEx or OpEx for downstream reporting.
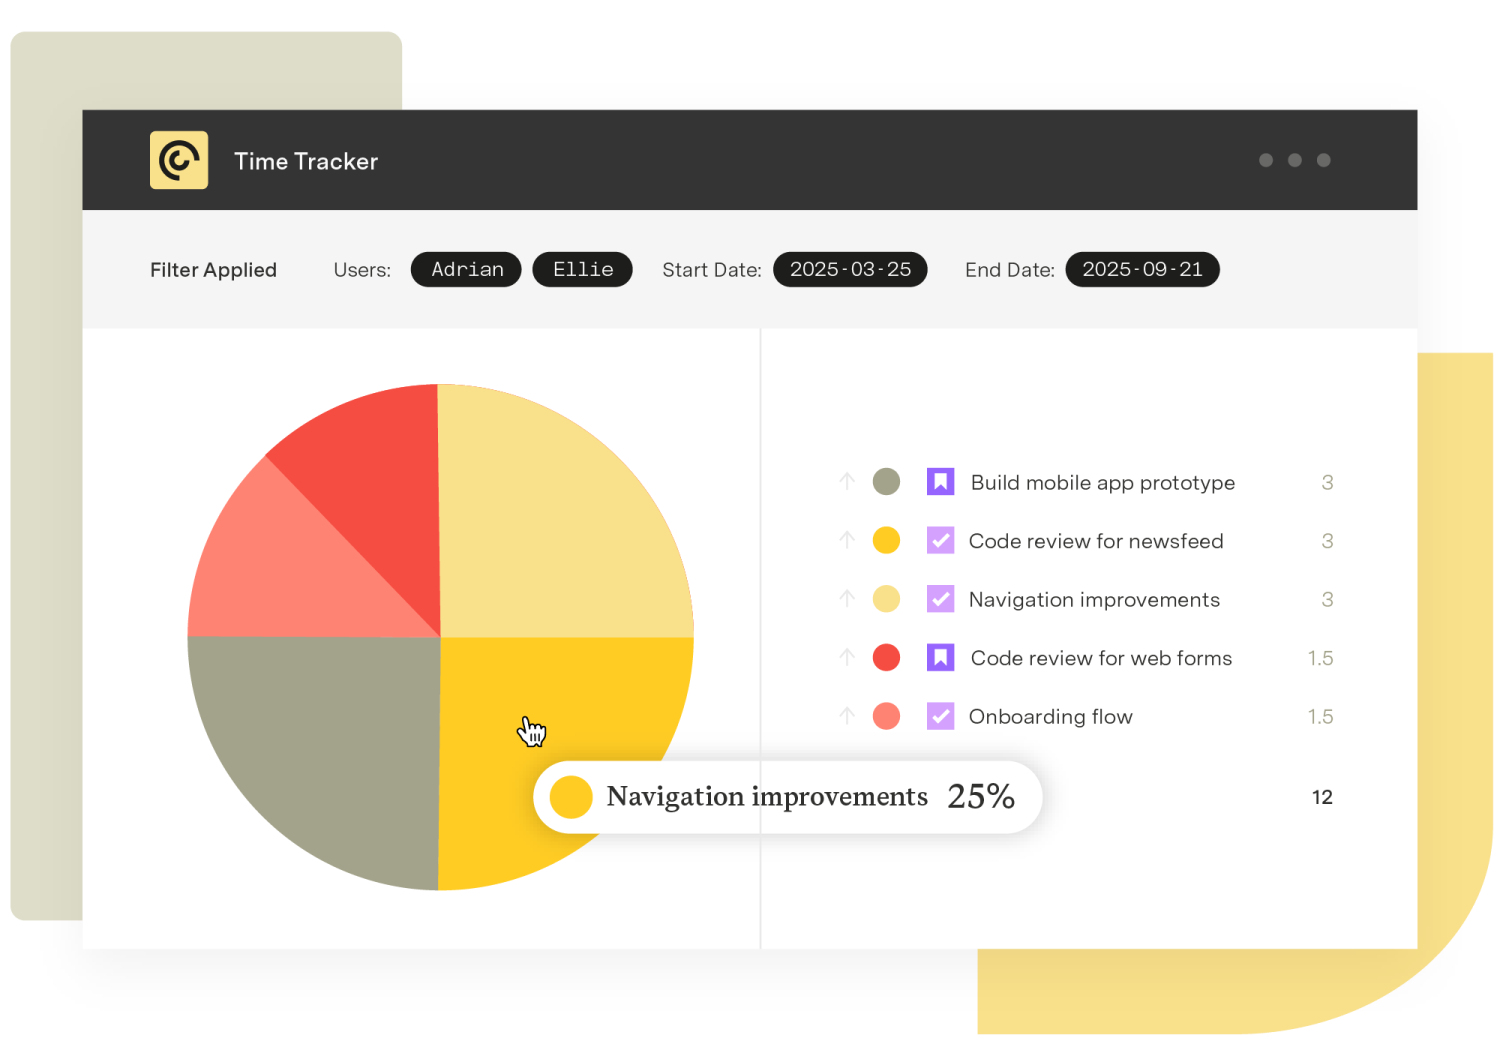
Pair Timesheets with Custom Charts for Jira to visualize the variance on a dashboard. Custom Charts pulls Timesheets data and renders estimated vs actual as a bar chart, table, or grouped view that managers can keep open during sprint reviews.
Sign up for a demo
Request Demo