
Burnup reports help teams understand how much work has been completed over time – while also showing how scope changes affect delivery. Unlike burndown charts, which focus on remaining work, a burnup report visualizes completed work against the total scope, making it easier to see progress even when requirements change.
With Tempo Timesheets, burnup reporting goes beyond story points. By grounding progress in actual logged time, Tempo helps teams, managers, and stakeholders see how real effort translates into delivery – across sprints, projects, and long-running initiatives.
What is a burnup report?
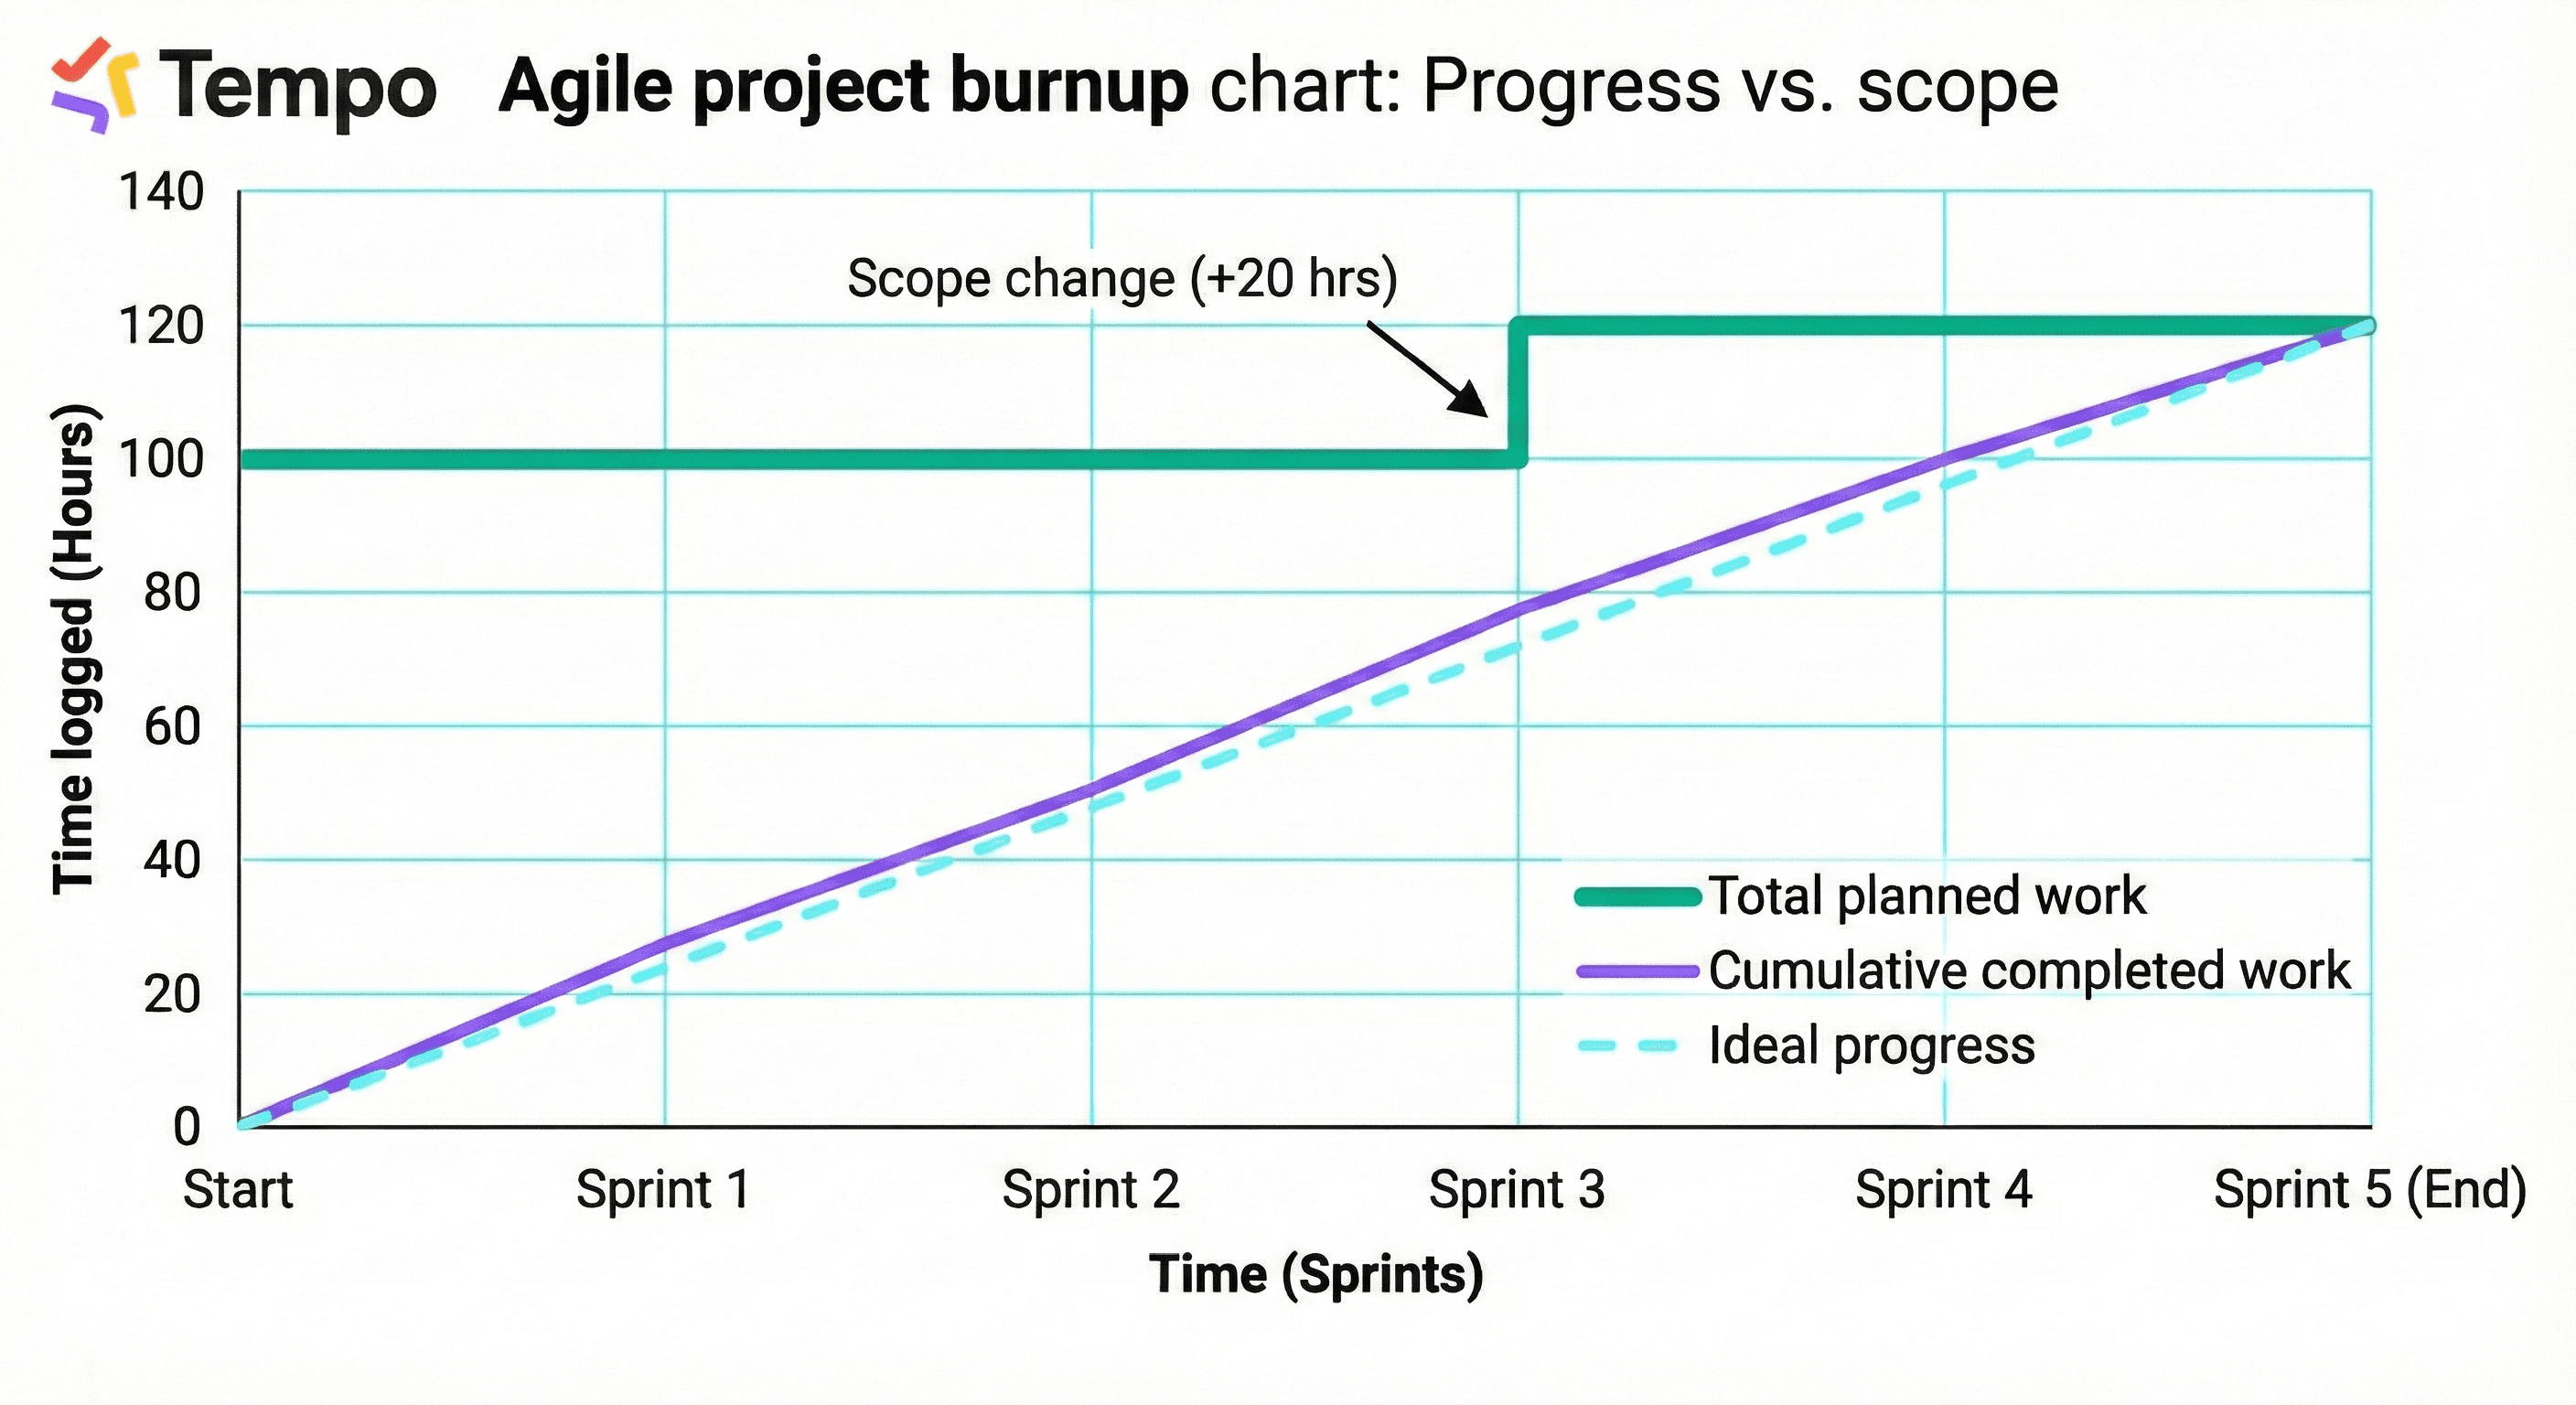
A burnup report is a chart that shows two key lines over time: completed work (how much work has been finished so far) and total scope (the full amount of work planned, including any changes).
As work is completed, the completed line moves upward. When scope changes – such as new work being added – the total scope line shifts accordingly. This makes burnup reports especially useful for understanding progress in environments where scope is expected to evolve.
In Jira and agile teams, burnup reports are commonly used to track delivery progress without masking scope changes, communicate progress clearly to stakeholders, and support forecasting for releases or longer-term initiatives. While burndown charts are more popular, sometimes teams would rather see how much work they have done, rather than how much they have left. Scope creep is typically clearer and easier to see in burnup charts.
The value of burnup reports
Burnup reports provide clarity where traditional reports fall short. They help teams maintain transparency when scope changes. Instead of hiding scope creep, burnup reports make it visible – so teams can respond early.
Stakeholders can see what's been completed and how scope has evolved over time. By understanding how quickly completed work grows relative to scope, teams can better predict delivery timelines. When work is added mid-stream, burnup reports avoid the confusion that can arise in burndown charts.
Burnup reporting with Tempo Timesheets
Tempo brings a time-based perspective to burnup reporting by combining Jira issue data with accurate worklog data from Tempo Timesheets.
With Tempo, burnup reporting can reflect actual logged hours instead of estimates alone, progress across multiple teams or projects, and real effort invested over time, not just task completion.
Because Tempo captures when and where time is logged, burnup reports can be built to show how completed effort accumulates against planned or total scope – giving a more reliable view of delivery.
What makes Tempo's burnup reporting different
Time-based progress, not just story points
Most burnup reports focus on issues or story points. Tempo adds depth by enabling burnup views based on actual time logged, helping teams understand how effort translates into outcomes.
Flexible scope across Jira
With Tempo's reporting and integrations, burnup reports can span multiple Jira projects, epics or initiatives, and teams, roles, or accounts. This makes burnup reporting useful not only for sprints, but also for cross-team initiatives and long-running work.
Works seamlessly inside Jira
Tempo Timesheets is built for the Atlassian ecosystem. Teams can log time, manage work, and analyze progress without leaving Jira – reducing friction and improving data quality.
Powerful reporting and visualization options
By combining Timesheets with tools like Structure or Custom Charts for Jira, teams can create burnup visualizations that reflect complex scopes, evolving work, and real delivery patterns.
Create burnup reports with Custom Charts
If you're looking to stay on top of project progress and avoid scope creep, a burnup report is an excellent tool. With the help of Custom Charts for Jira and Confluence, you can make highly customizable burnup reports on a Jira dashboard or Confluence page.
Standard Jira burnup charts
There is a burnup chart available out of the box in Jira. However, it is a project report, not a dashboard gadget. That means you cannot add the report to a Jira dashboard. Nor can you customize it.
The standard Jira burnup chart can only report on a single sprint. You can't see progress on an epic or release. You also can't see progress on more than one sprint. This is a problem if you're a big enterprise with multiple agile teams and you want to see progress over time across all their work.
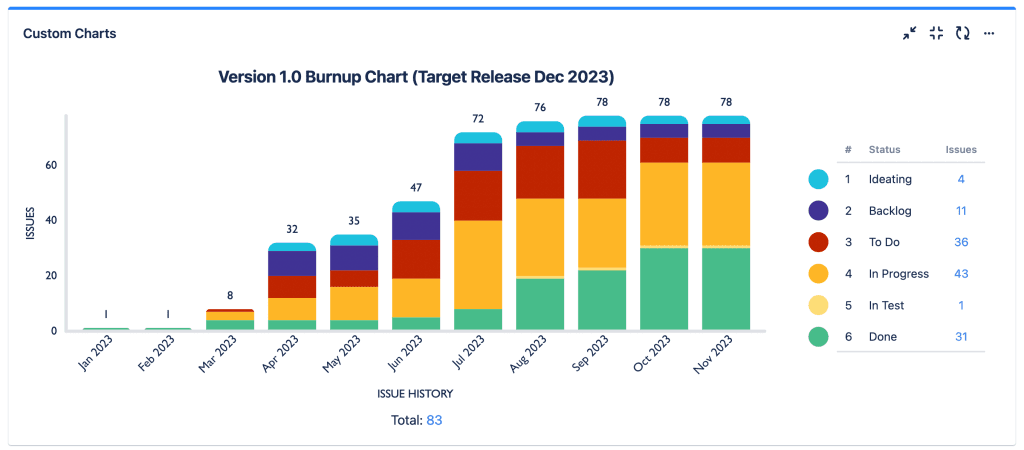
Build flexible burnup reports with Custom Charts
Custom Charts lets you build flexible issue history reports on your Jira dashboards and Confluence pages.
With Custom Charts, you can build burnups of individual or multiple sprints, epics, releases, teams, and projects. This makes them useful both for individual agile teams and Scrum Masters/product owners, and program managers who want a bird's eye view of whether all their teams are on schedule to deliver.
With an extensive range of customization options, you can make burnups that look exactly how you want them to, tailoring them to meet the specific needs of your team and stakeholders.
You can create burnups and all kinds of other charts by adding the Custom Charts gadget to your Jira dashboard, or by adding the Custom Charts macro to your Confluence page. To create a burnup or burndown, choose a 2D chart and select "Issue History" from the Chart By dropdown, and "Status" from the Group By dropdown.
Create time-based burnup reports with Timesheets
If you use Timesheets to log and track time on your customer accounts, then you can create a burnup that shows the progress of hours worked on an account.
For this you'll need the Account Custom Budget Burnup Gadget, which you can add to your Jira dashboard. You can insert a custom budget (using the Insert goal field) and period. The gadget provides flexibility in how data is visualized and helps managers and executives to monitor progress on accounts, and to plan and allocate resources accordingly.
Accurate and consistent time tracking is key to an effective Timesheets burnup report. Encourage your team to regularly log time in Timesheets to ensure your data is reliable.
When new work is added, the total scope line adjusts – clearly showing scope growth. Managers review progress trends to assess delivery risk and capacity. Stakeholders use the report to understand progress without misreading scope changes.
Best practices for burnup reporting
Log time consistently to ensure burnup data reflects real effort. Review scope changes regularly to understand their impact on delivery. Use burnup alongside burndown for a balanced view of progress and remaining work.
Filter reports by team or project to uncover where effort is concentrated. Use historical burnup data to improve future planning and forecasting.
Get more from your agile reporting
Tempo Timesheets turns burnup reports into a reliable source of truth by grounding progress in real work performed. By combining time tracking, flexible reporting, and deep Jira integration, Tempo helps teams move beyond surface-level metrics and gain confidence in how progress, scope, and effort align.
Credit reporting giant TransUnion saved $750,000 annually using Timesheets. See how they did it.
TransUnion saves $750,000 annually with Timesheets
Read the TransUnion case study


