
Visualize work progress with Tempo burndown reports
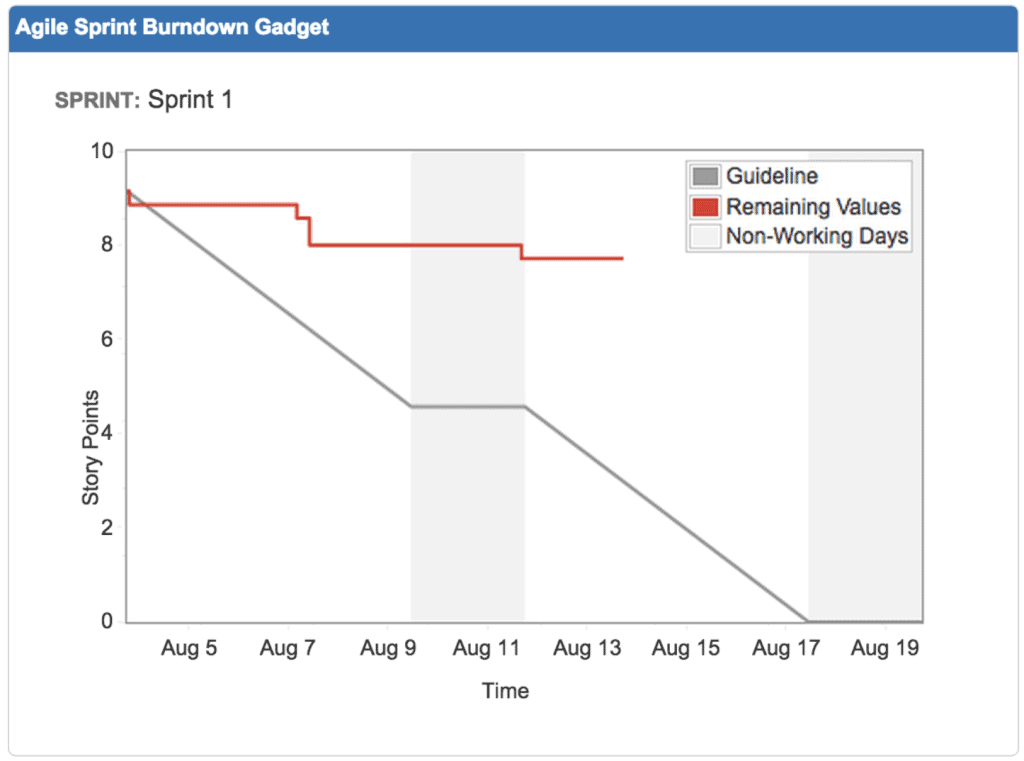
A burndown report (or burndown chart) is a visual tool that tracks remaining work over time. It helps teams measure progress toward sprint or project goals. The vertical axis shows how much work is left (in hours, tasks, or story points), and the horizontal axis represents time – usually a sprint or release period.
In agile and Jira environments, a burndown report helps teams instantly see the total work planned at the start of a sprint, how quickly work is being completed, and whether the team is on track to meet its sprint or release goals.
Tempo's burndown chart builds on this foundation by linking actual logged time to real progress. This gives teams a far more accurate picture of how work unfolds.
Track sprint health and team efficiency
A Jira burndown report powered by Tempo is more than a progress chart. It's an operational dashboard for sprint health and team efficiency. You can track sprint progress at a glance and quickly see if your team is ahead or behind schedule.
When progress lags behind the ideal line, managers can identify blockers and inefficiencies early. You'll understand trends in time logged versus time remaining to forecast delivery more accurately. Burndown charts create a shared, visual understanding of project status for teams and stakeholders alike.
Connect time tracking to burndown insights
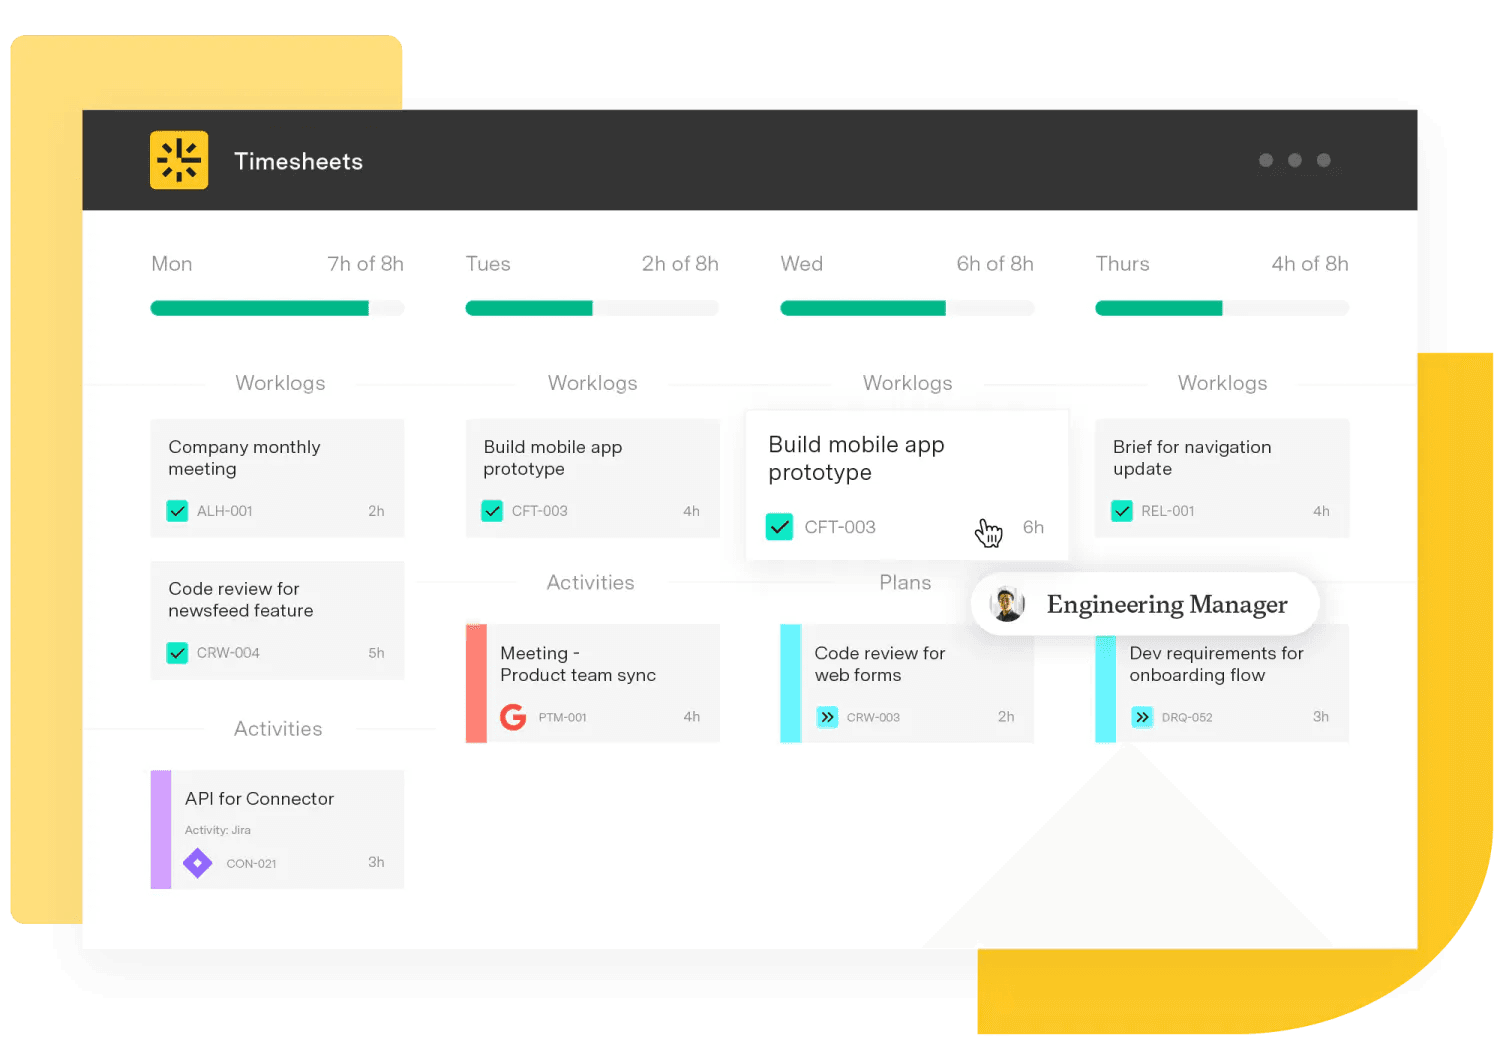
Tempo's burndown capabilities are powered by Tempo Timesheets, giving you deeper insight than standard agile tools. With Timesheets and Tempo Planner, teams can visualize actual logged time versus planned hours, capacity and allocation trends across users, teams, and projects, and historical progress patterns for improving estimation accuracy.
Unlike generic burndown charts that rely only on story points, Tempo combines time tracking data with agile reporting to produce a more actionable report.
Key benefits of Tempo burndown reports
Accurate time-based insights
Tempo's burndown report connects your timesheet data directly to project progress. You can see how real logged hours align with planned work. This depth of insight goes beyond story points to reveal true team effort and capacity usage.
Advanced filtering and customization
Customize your burndown chart by project, team, account, or user. Tempo's flexible filters make it easy to analyze progress across multiple teams, epics, or accounts – all within Jira.
Seamless Jira integration
Tempo's burndown reporting lives inside Jira, so teams can track issues, log time, and visualize sprint progress without switching tools. It's a natural extension of your agile workflow and Atlassian ecosystem.
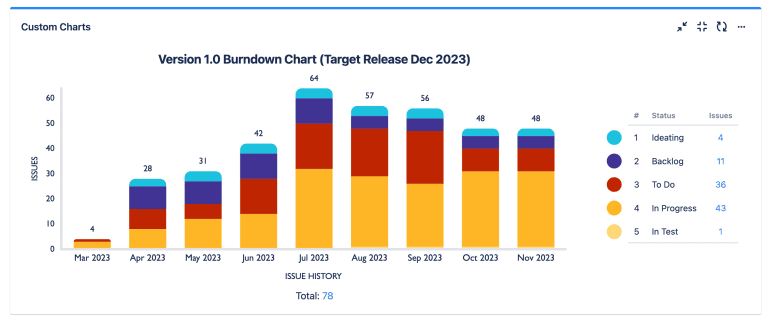
Multi-team and cross-project visibility
With integrations like Structure and Custom Charts for Jira, Tempo enables powerful burndown views that span multiple teams, projects, or epics – turning complexity into clarity. This is ideal for portfolio-level reporting.
Deeper context through time tracking
Unlike some burndown charts, Tempo's version incorporates time tracking data directly from Jira. This makes it valuable for agile, service management, and billable teams alike.
Build a burndown report in Jira with Tempo
Here's how teams can use Tempo Timesheets to generate actionable burndown insights. Start by estimating total hours or workload at the start of the sprint (for example, 120 hours). Team members log time daily using Timesheets.
The burndown report updates automatically, showing remaining time versus ideal progress. If the remaining hours aren't dropping as expected, teams can identify scope creep or blockers. Filter by project, team, or issue type to see where bottlenecks exist.
Review results at sprint close, export the chart, and share insights with stakeholders. Over time, use historical data to improve estimation accuracy and sprint planning.
Best practices for agile teams using Tempo burndown charts
Log time daily to keep burndown data accurate. Track both planned and logged hours to reveal discrepancies early. Use filters for granular insights – analyze by user, project, or account.
Compare multiple sprints to refine estimates and improve velocity. Include burndown reviews in retrospectives to drive continuous improvement.
Try integrating calendars and automating timesheet entries with AI suggestions to make the process as simple and accurate as possible for your teams.
Credit reporting giant TransUnion saved $750,000 annually using Timesheets. See how they did it.
TransUnion saves $750,000 annually with Timesheets
Read the TransUnion case studyGet more from your agile reporting
Tempo's burndown reports for Jira bring together agile tracking, time logging, and project planning into one unified view. By visualizing actual hours worked against planned goals, Tempo gives your teams the insight they need to stay on track and deliver on time.


